The PANDA Challenge
This is chapter 4 of my PhD thesis, defended at Radboud University in . The text is the thesis version: it was adapted from the paper below and differs from the published article in wording and layout, but the data, results and conclusions are the same.
Want the short version? I wrote about this work on the blog:
- Original title
- Artificial intelligence for diagnosis and Gleason grading of prostate cancer: the PANDA challenge
- Published in
- Nature Medicine 28(1), 154–163 (2022). doi:10.1038/s41591-021-01620-2
- Authors
-
Wouter Bulten, Kimmo Kartasalo, Po-Hsuan Cameron Chen and 31 more Wouter Bulten, Kimmo Kartasalo, Po-Hsuan Cameron Chen, Peter Ström, Hans Pinckaers, Kunal Nagpal, Yuannan Cai, David F. Steiner, Hester van Boven, Robert Vink, Christina Hulsbergen-van de Kaa, Jeroen van der Laak, Mahul B. Amin, Andrew J. Evans, Theodorus van der Kwast, Robert Allan, Peter A. Humphrey, Henrik Grönberg, Hemamali Samaratunga, Brett Delahunt, Toyonori Tsuzuki, Tomi Häkkinen, Lars Egevad, Maggie Demkin, Sohier Dane, Fraser Tan, Masi Valkonen, Greg S. Corrado, Lily Peng, Craig H. Mermel, Pekka Ruusuvuori, Geert Litjens, Martin Eklund, the PANDA challenge consortium
- Licence
- the published article is CC BY 4.0; this chapter is shared under the same licence.
On this page 11 sections
- Abstract
- Introduction
- Results
- Characteristics of the datasets
- Reference standards of the datasets
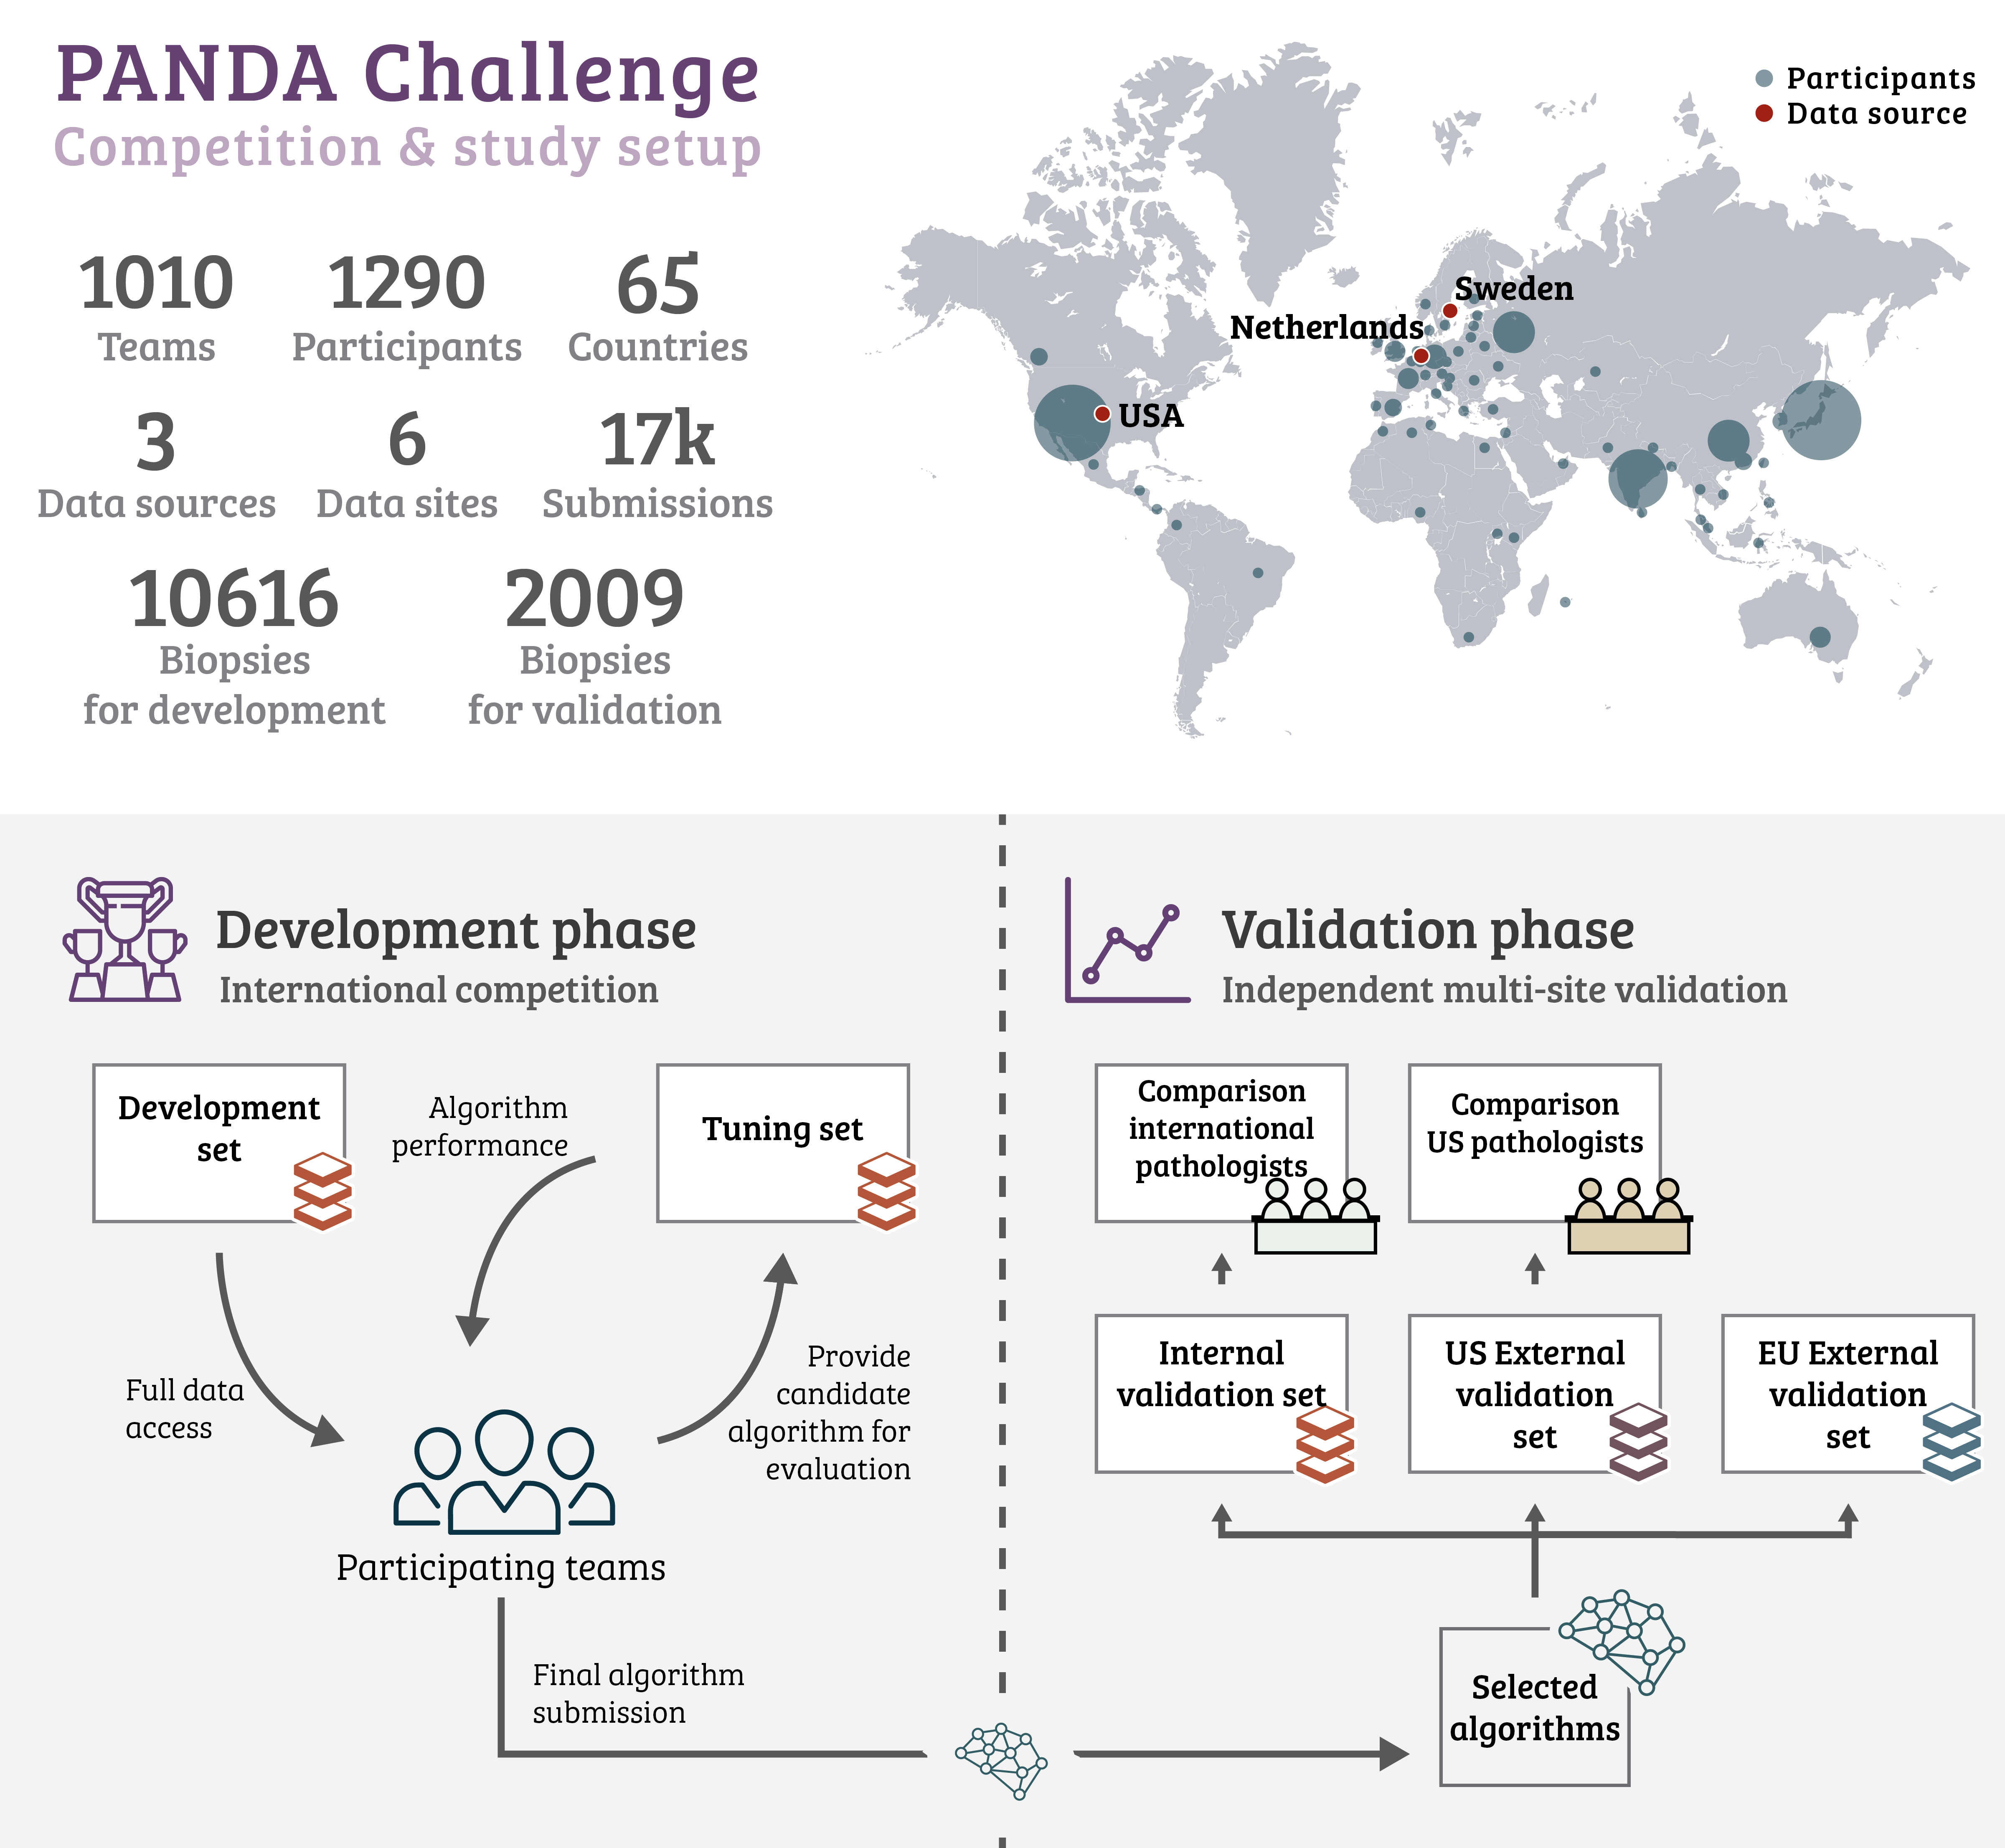
- Overview of the competition
- Overview of evaluated algorithms
- Classification performance in the internal validation dataset
- Classification performance in the external validation datasets
- Classification performance compared to pathologists
- Discussion
- Methods
- Study design
- Reproducing algorithms and application to validation sets
- Statistical analysis
- Data availability
- Code availability
- Acknowledgements
- The PANDA Consortium
- Pathologist participating in the international pathologists comparison
- Uropathologists who set the reference standard of the US external validation set
- Algorithm developers
- Supplementary methods
- Dataset inclusion and exclusion criteria
- Reference standard protocol
- Pathologist comparison review protocol
- Available training data during the competition
- Kaggle competition platform
- Methods to select the 15 teams for external validation
- Summary of participating teams’ methods
- Supplementary figures
- Supplementary tables
- References
Abstract
Artificial intelligence (AI) has shown promise for diagnosing prostate cancer in biopsies. However, results have been limited to individual studies, lacking validation in multinational settings. Competitions have shown to be accelerators for medical imaging innovations, but their impact is equally hindered by lack of reproducibility and independent validation. With this in mind, we organized the PANDA challenge – the largest histopathology competition to date, joined by 1,290 developers – to catalyze development of fully reproducible AI algorithms for Gleason grading using 10,616 digitized prostate biopsies. We validated that a diverse set of submitted algorithms reach pathologist-level performance on independent cross-continental cohorts, fully blinded to the algorithm developers. The results warrant evaluating AI in prospective clinical trials.
Introduction
Gleason grading1 of biopsies yields important prognostic information for prostate cancer patients and is a key element for treatment planning.2 Pathologists characterize tumors into different Gleason growth patterns based on the histologic architecture of the tumor tissue. Based on the distribution of Gleason patterns, biopsy specimens are categorized into one of five International Society of Urological Pathology (ISUP) grade groups.34 This assessment is inherently subjective with considerable inter- and intra-pathologist variability,56 leading to both undergrading and overgrading of prostate cancer.68
Individual artificial intelligence (AI) algorithms have shown promise in grading prostate cancer in biopsies911 and assisting pathologists in the microscopic reviews.1213 However, AI algorithms are susceptible to various biases in their development and validation.1415 This can result in algorithms that perform poorly outside the cohorts used for their development. Moreover, shortcomings in validating the algorithms’ performance on additional cohorts may lead to such deficiencies in generalization to go unnoticed.1617 Algorithms are also often developed and validated in a siloed manner: the same researchers who develop the algorithms also validate them, introducing a risk of positive bias. This includes establishing the validation cohorts and selecting the pathologists providing the reference standard. There has yet to be an independent evaluation of algorithms for prostate cancer diagnosis and grading to assess whether they generalize across different patient populations, pathology labs, digital pathology scanner providers, and across reference standards derived from intercontinental panels of uropathologists. This represents a key barrier to implementation of algorithms in clinical practice.
AI competitions have been an effective approach to crowd-source the development of performant algorithms.18 Despite their effectiveness in facilitating innovation, competitions still tend to suffer from a set of limitations. Validation of the resulting algorithms has typically not been performed independently of the algorithm developers. In a competitive setup, the incentive for conscious or subconscious introduction of positive bias by the developers is arguably further increased, and lack of independent validation also means that the technical reproducibility of the proposed solutions is not verified. Moreover, competitions have typically not been followed up by validation of the algorithms on additional international cohorts, casting doubts on whether the resulting solutions possess the generalization capability to truly answer the underlying clinical problem, as opposed to being fine-tuned for a particular competition design and dataset.19
Through this study, we aimed to advance the methodology for the design and evaluation of medical imaging AI innovations to develop and rigorously validate the next generation of algorithms for prostate cancer diagnostics. We organized a global AI competition, the Prostate cANcer graDe Assessment (PANDA) Challenge, by compiling and publicly releasing a European (EU) cohort for AI development, the largest publicly available dataset of prostate biopsies as of yet. Secondly, we fully reproduced top-performing algorithms’ and externally validated their generalization to independent United States (US) and EU cohorts and compared them to pathologists. The competition setup isolated the developers from the independent evaluation of the algorithms’ performance, minimizing the potential for information leakage and offering a true assessment of the diagnostic power of these techniques. Taken together, we show how the combination of AI and innovative study designs, together with pre-specified and rigorous validation across diverse cohorts can be utilized to solve challenging and important medical problems.
Results
Characteristics of the datasets
In total, 12,625 whole-slide images (WSI) of prostate biopsies were retrospectively collected from 6 different sites for algorithm development, tuning, and independent validation (Table 4.1, Supplementary Figures 1, 2, 3 and 4). Of these, 10,616 biopsies were available for model development (the development set), 393 for performance evaluation during the competition phase (the tuning set), 545 as the internal validation set in the post-competition phase, and 1,071 for external validation.
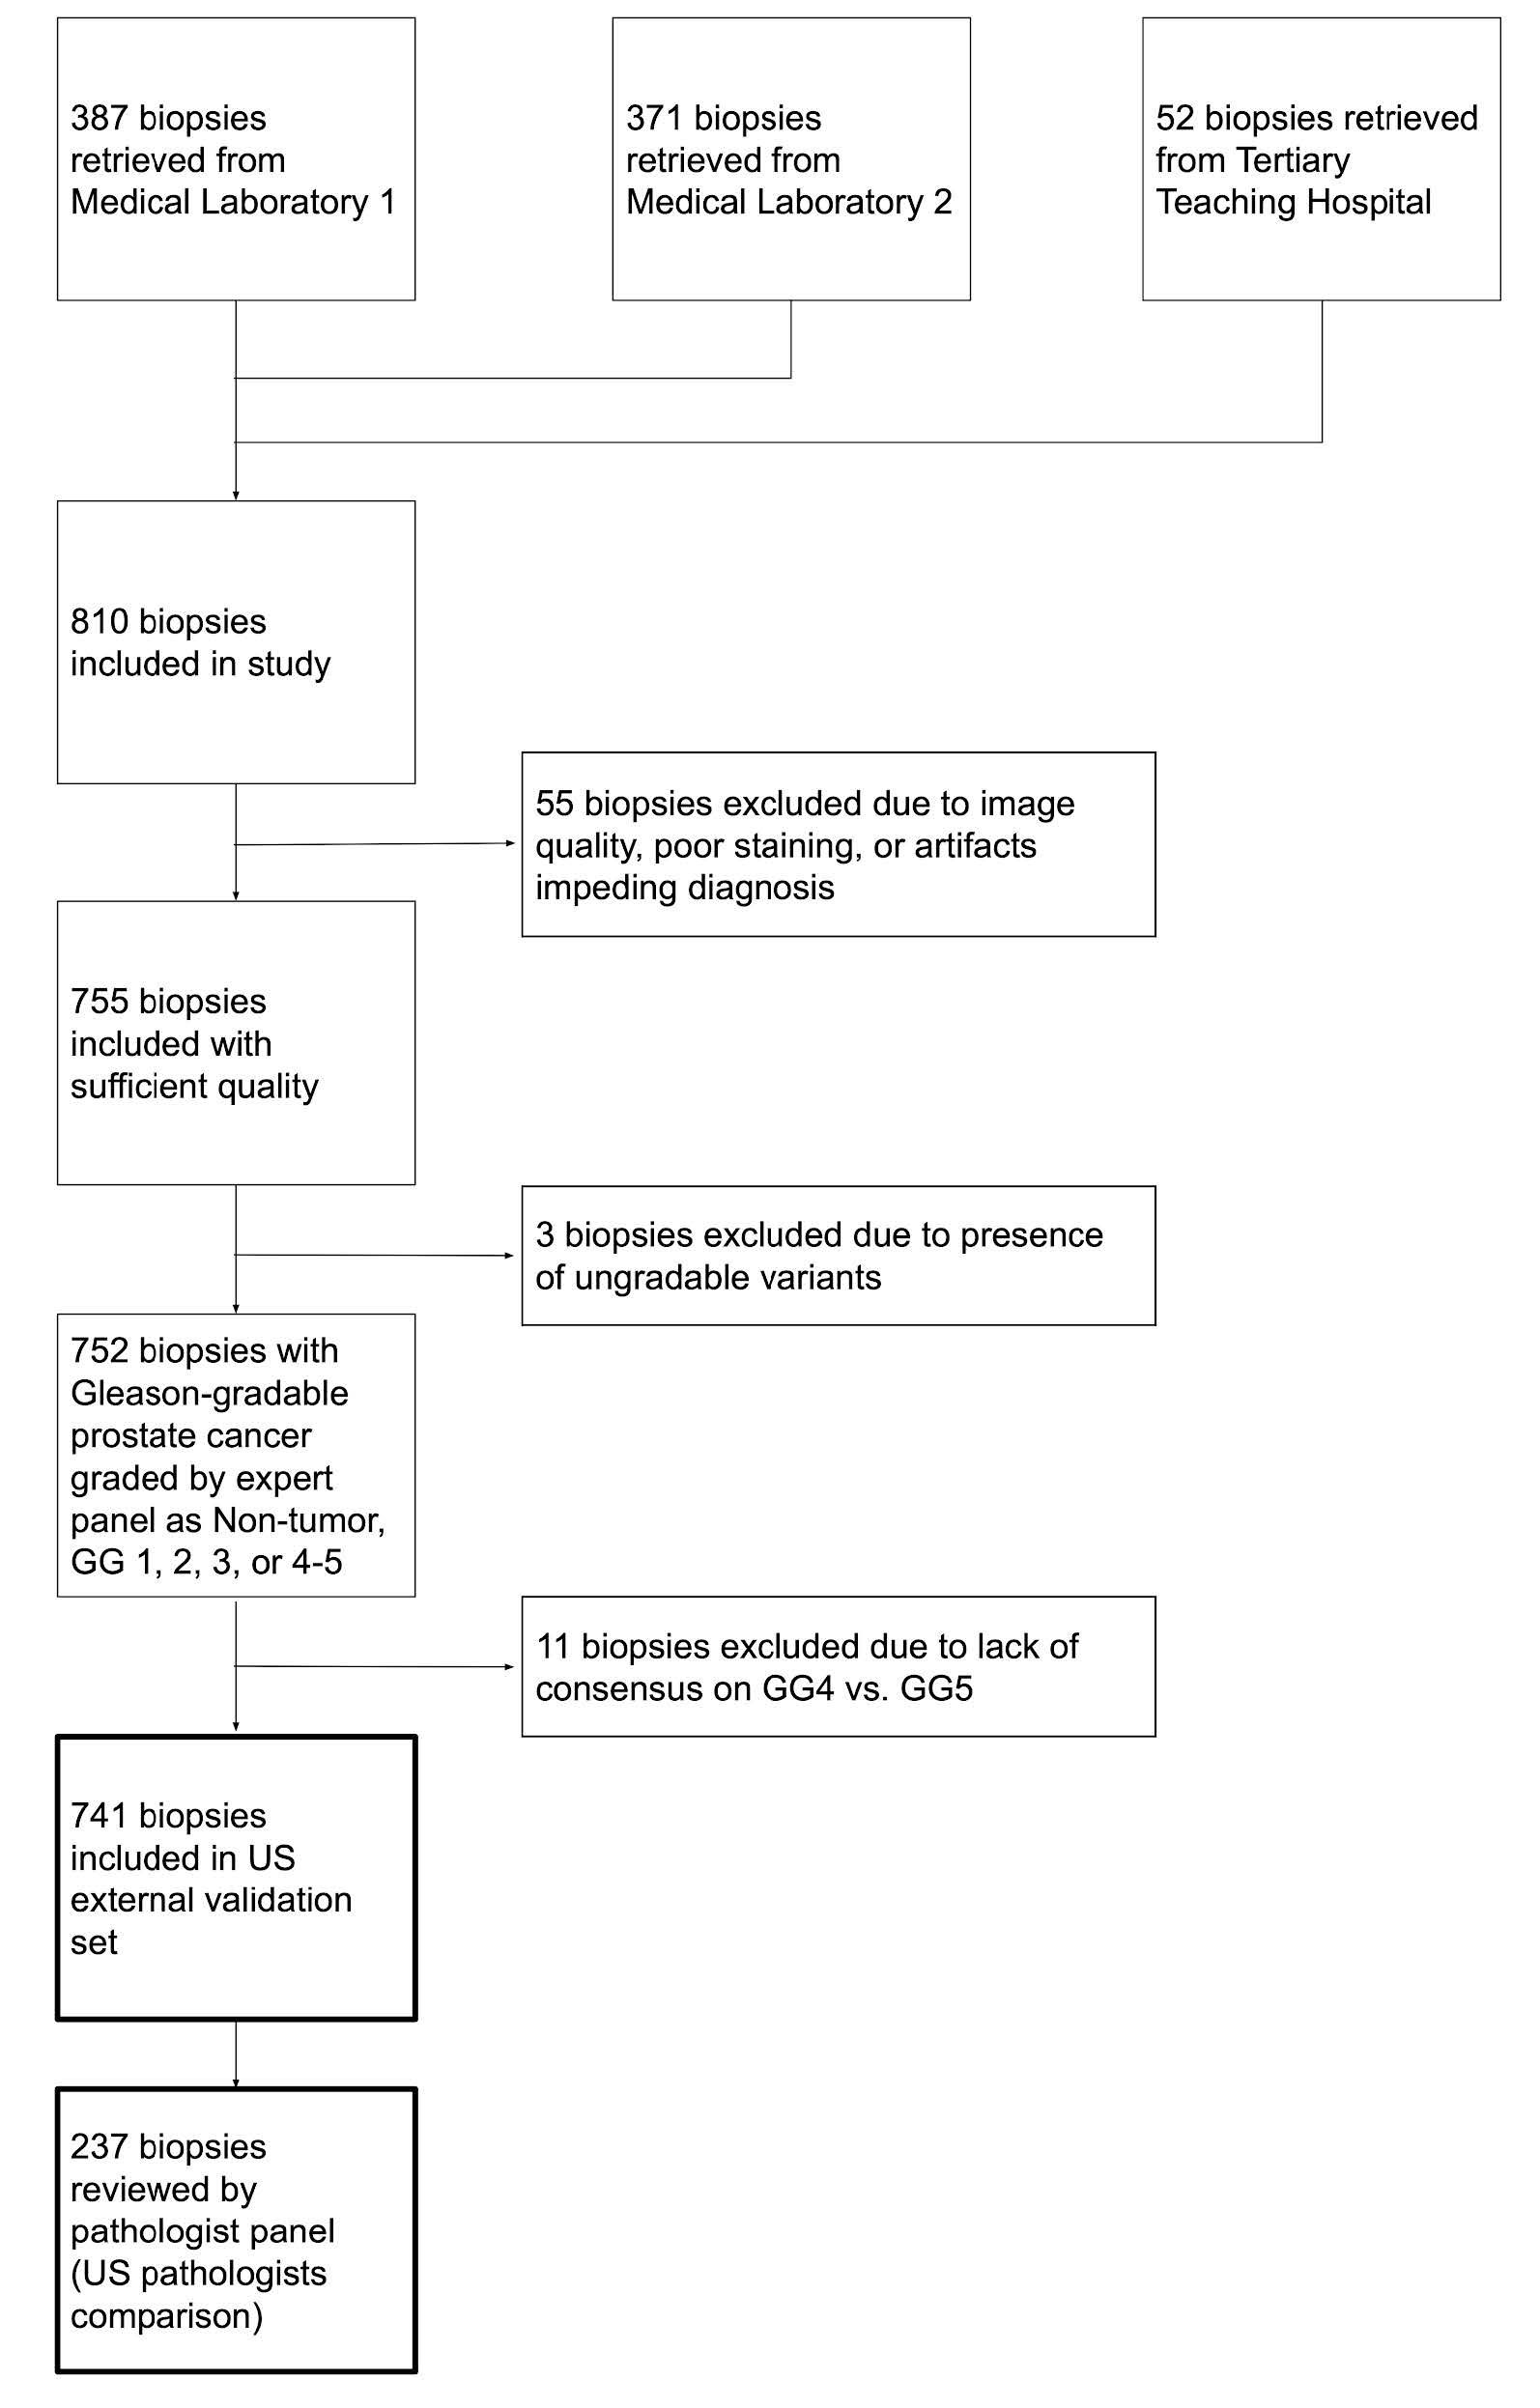
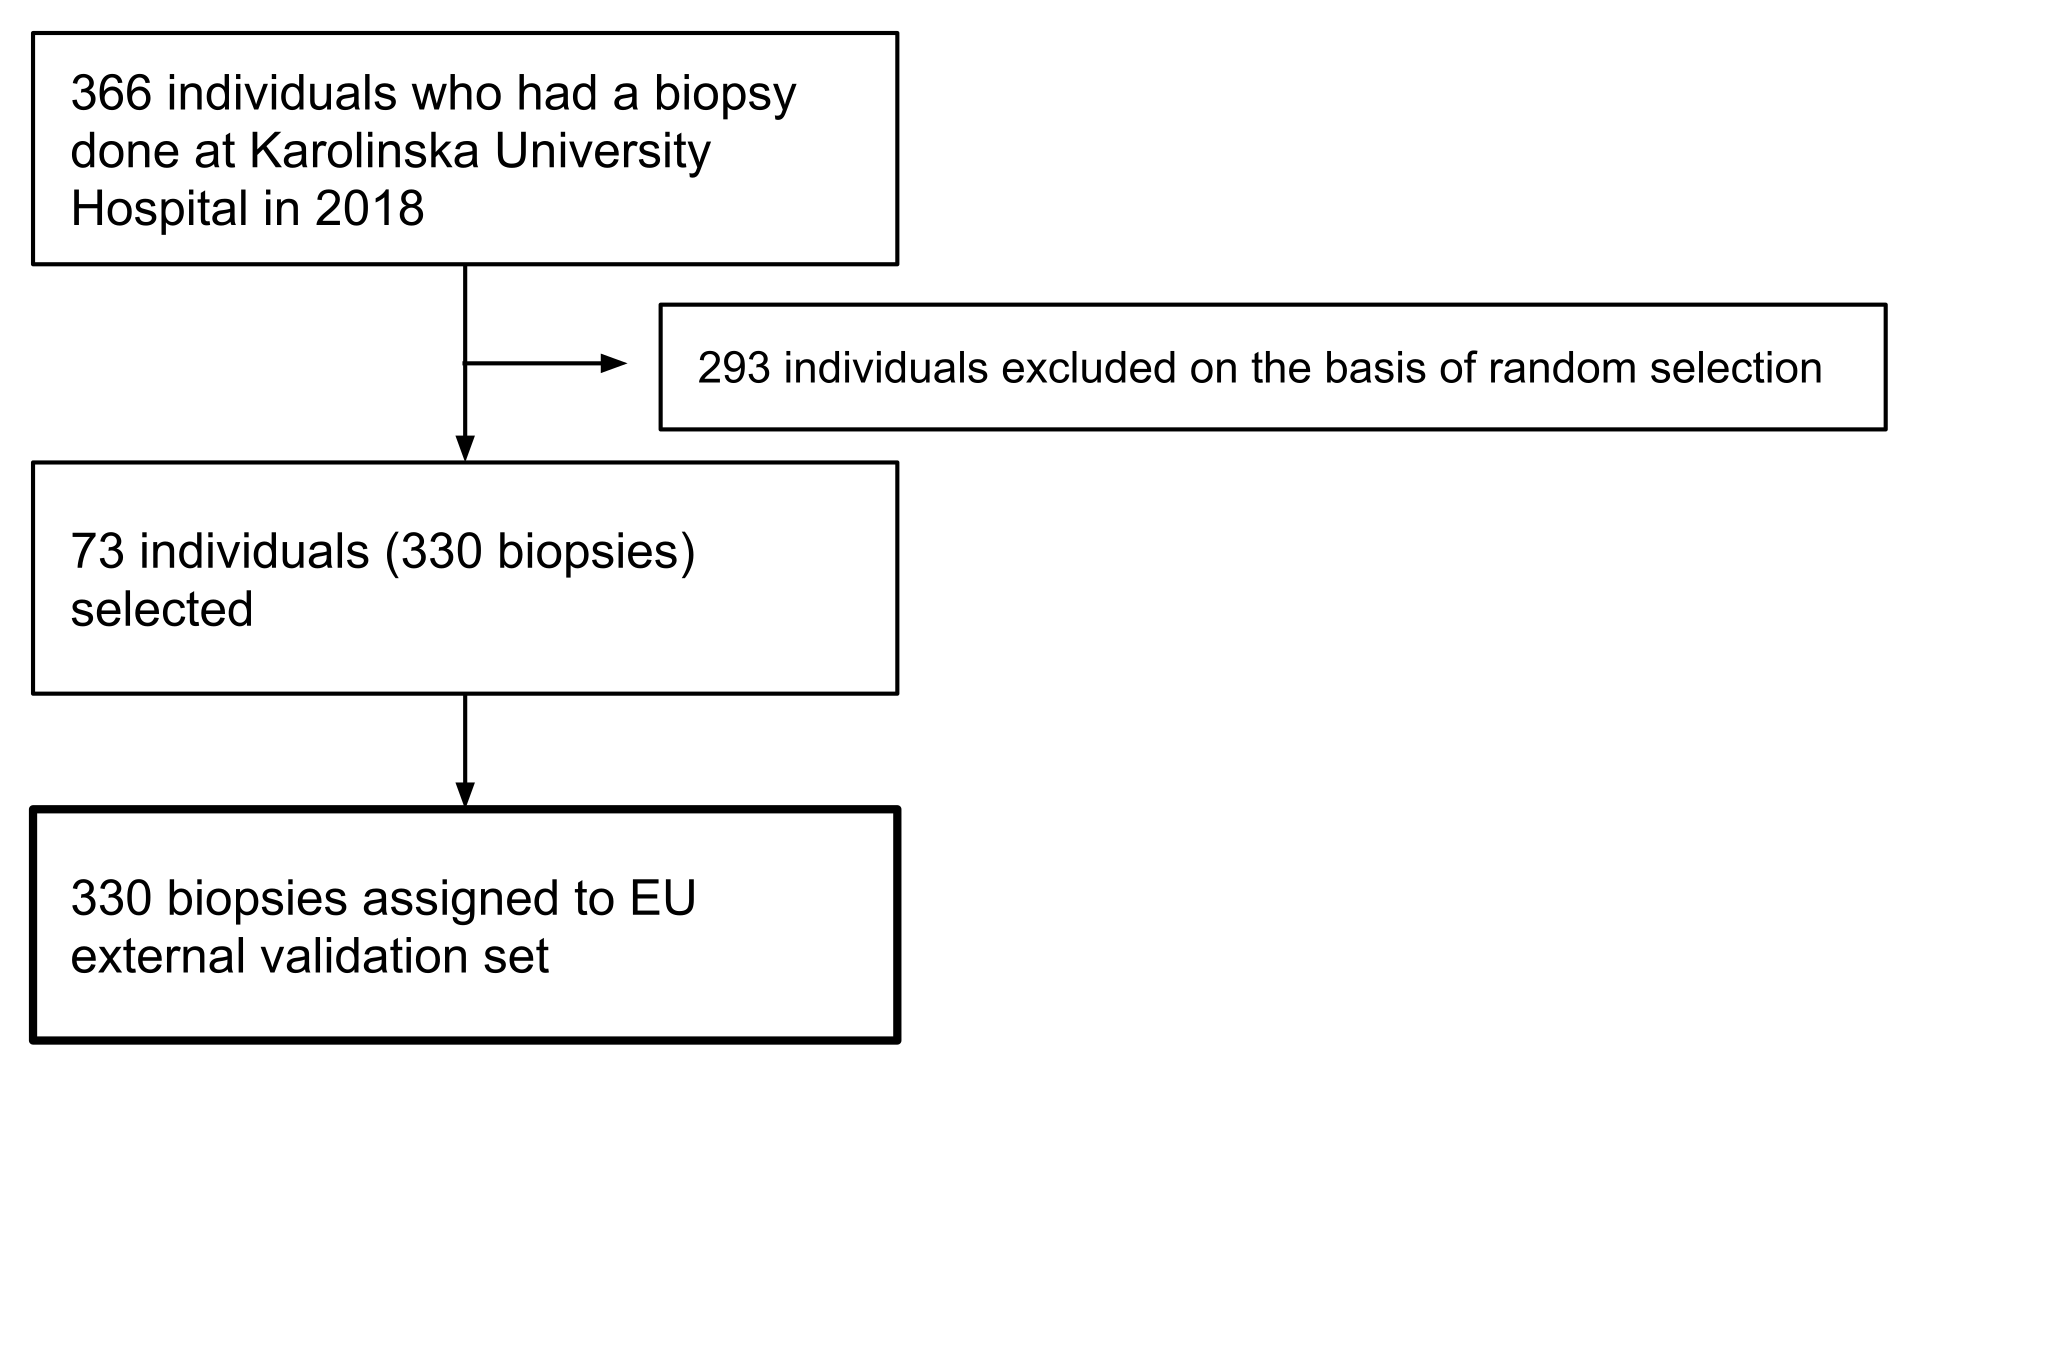
Cases for development, tuning and internal validation originated from Radboud University Medical Center, Nijmegen, The Netherlands and Karolinska Institutet, Stockholm, Sweden (Supplementary Figures 1 and 2 and Methods Dataset inclusion and exclusion criteria and Reference standard protocol). The external validation data consisted of a US and an EU set (Supplementary Figures 3 and 4). The US set contained 741 cases and was obtained from two independent medical laboratories and a tertiary teaching hospital. The EU external validation set contained 330 cases and was obtained from the Karolinska University Hospital, Stockholm, Sweden. The histological preparation and scanning of the external validation samples were performed by different laboratories than those responsible for the development, tuning and internal validation data.
| EU Development set (Radboud) | EU Development set (Karolinska) | EU Tuning Set (Radboud) | EU Tuning Set (Karolinska) | EU Internal Validation (Radboud) | EU Internal Validation (Karolinska) | US External Validation | EU External Validation | Total | |
|---|---|---|---|---|---|---|---|---|---|
| Source | Radboud Univ. Medical Cent., Netherlands | Karolinska Institutet, Sweden | Radboud Univ. Medical Cent. Netherlands | Karolinska Institutet, Sweden | Radboud Univ. Medical Cent., Netherlands | Karolinska Institutet, Sweden | Medical Lab., CA/UT, USA; Tertiary Teaching Hosp., CA, USA | Karolinska Univ. Hosp., Sweden | - |
| Number of sites | 1 | 1 | 1 | 1 | 1 | 1 | 3 | 1 | 6 |
| # of cases | 1028 | 1085 | 72 | 33 | 129 | 82 | 741 | 330 | 3500 |
| # of biopsies | 5160 | 5456 | 195 | 198 | 333 | 212 | 741 | 330 | 12625 |
| Non-tumor | 967 (19%) | 1925 (35%) | 95 (49%) | 58 (29%) | 155 (47%) | 66 (31%) | 254 (34%) | 108 (33%) | 3628 (29%) |
| Tumor-containing | 4193 (81%) | 3531 (65%) | 100 (51%) | 140 (71%) | 178 (53%) | 146 (69%) | 487 (66%) | 222 (67%) | 8997 (71%) |
| Grade group 1 | 852 (17%) | 1814 (33%) | 24 (12%) | 48 (24%) | 48 (14%) | 53 (25%) | 247 (33%) | 65 (20%) | 3151 (25%) |
| Grade group 2 | 675 (13%) | 668 (12%) | 15 (8%) | 32 (16%) | 35 (11%) | 34 (16%) | 122 (16%) | 63 (19%) | 1644 (13%) |
| Grade group 3 | 925 (18%) | 317 (6%) | 15 (8%) | 14 (7%) | 38 (11%) | 16 (8%) | 70 (9%) | 49 (15%) | 1444 (11%) |
| Grade group 4 | 768 (15%) | 481 (9%) | 19 (10%) | 30 (15%) | 16 (5%) | 22 (10%) | 21 (3%) | 19 (6%) | 1376 (11%) |
| Grade group 5 | 973 (19%) | 251 (5%) | 27 (14%) | 16 (8%) | 41 (12%) | 21 (10%) | 27 (4%) | 26 (8%) | 1382 (11%) |
| Cases with pathologist reviews | - | - | - | - | 70 | - | 237 | - | 307 |
| # reviews | - | - | - | - | 910 | - | 4740 | - | 5650 |
Data characteristics of the development set, tuning set, internal validation set, and the two external validation sets. The development set was available to competition teams for algorithm development, and the tuning set for limited algorithm evaluation during the competition. All validation sets were fully independent and blinded to the algorithm developers. Additional details on reference standard protocol in Supplementary Methods Reference standard protocol and Pathologist comparison review protocol.
Reference standards of the datasets
The reference standard for the Dutch part of the internal validation set was determined through consensus of 3 uropathologists (C.H.v.d.K., R.V., H.v.B.) from 2 institutions with 18 to 28 years of clinical experience after residency (mean, 22 years). For the Swedish subset, 4 uropathologists (L.E., B.H., H.S., T.T.) from 4 institutions, all with over 25 years of clinical experience after residency, set the reference standard.
For the US external validation set, the reference standard was set through majority voting by 6 US or Canadian uropathologists (M.A., A.E., T.v.d.K., M.Z., R.A., P.H.) from 6 institutions with 18 to 34 years of clinical experience after residency (mean, 25 years). For this external dataset, immunohistochemistry was available to aid in tumor identification. The EU external validation set was reviewed by a single uropathologist (L.E.). For details on the uropathologist review protocol, see Supplementary Methods Reference standard protocol.
Overview of the competition
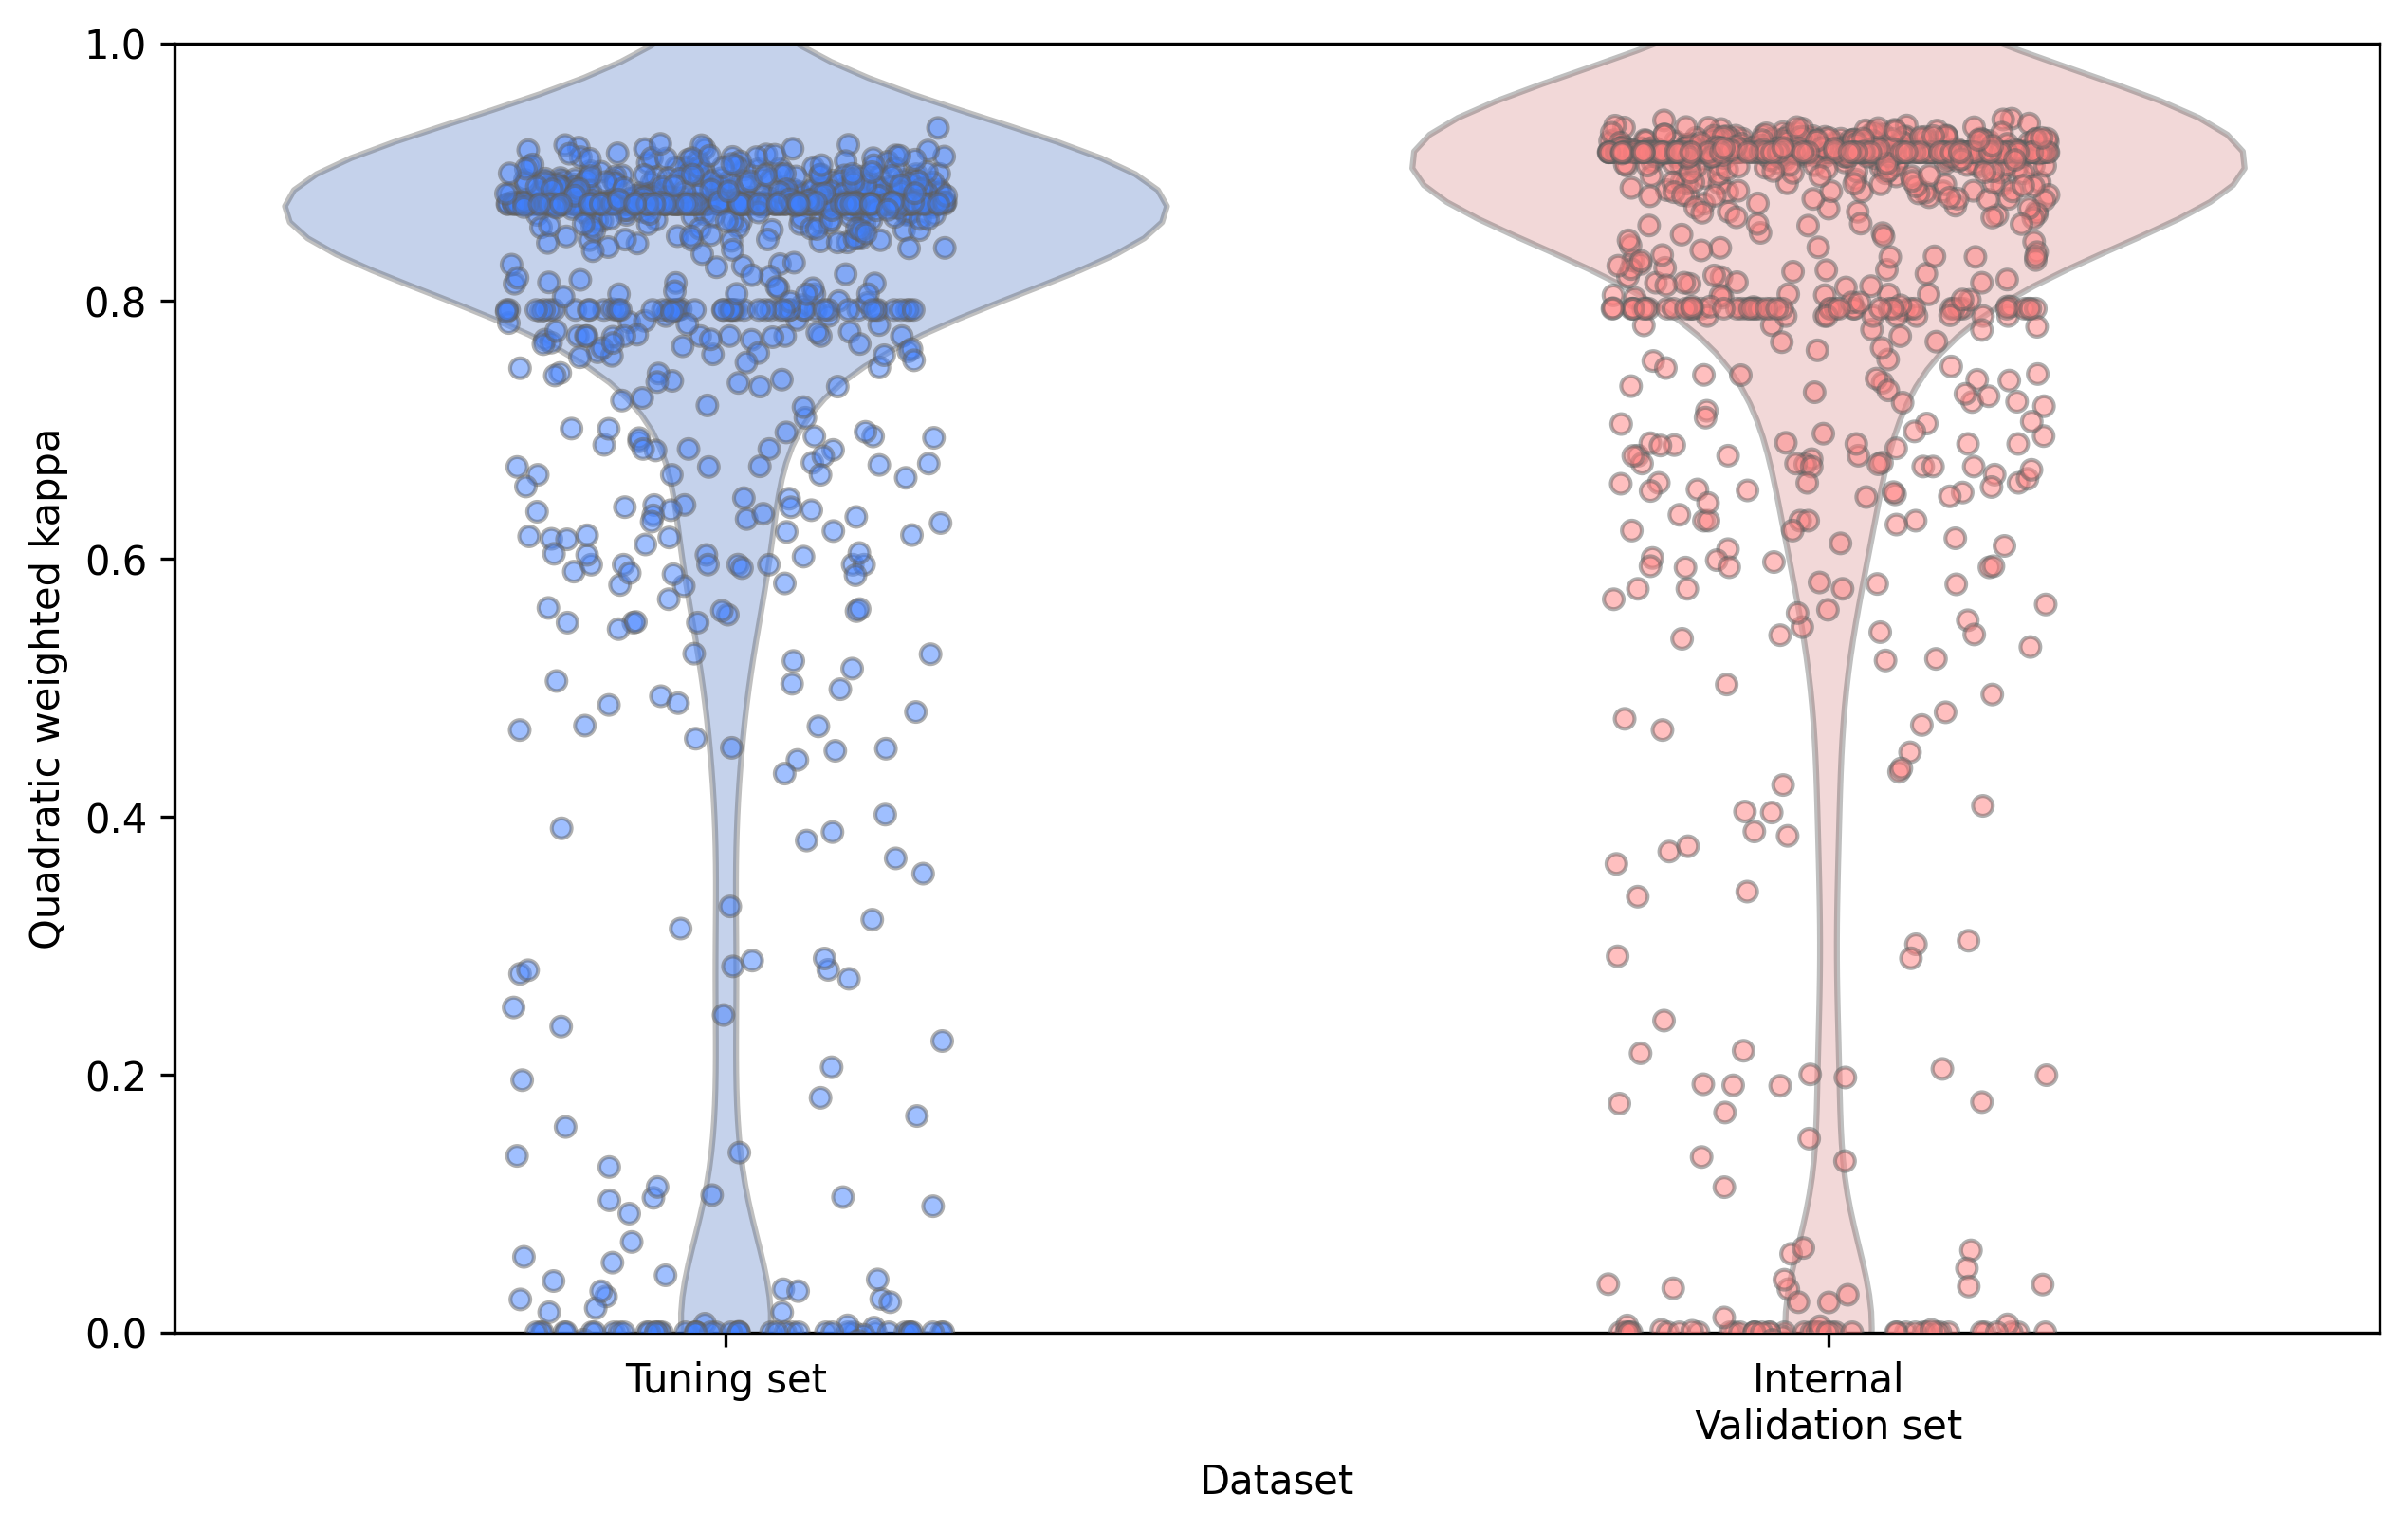
The study design of the PANDA challenge was pre-registered20 and consisted of a competition and a validation phase (Figure 4.1). The competition was open to participants from April 21st until July 23rd, 2020 and was hosted on the Kaggle platform (Supplementary Methods Kaggle competition platform). During the competition phase, 1,010 teams consisting of 1,290 developers from 65 countries participated and submitted at least one algorithm. Throughout the competition, teams could request a benchmark of their algorithm on the tuning set, and were then simultaneously blindly validated on the internal validation set (Figures 4.2 and 4.3). All teams combined submitted 34,262 versions of their algorithms, resulting in a total of 32,137,756 predictions made by the algorithms.
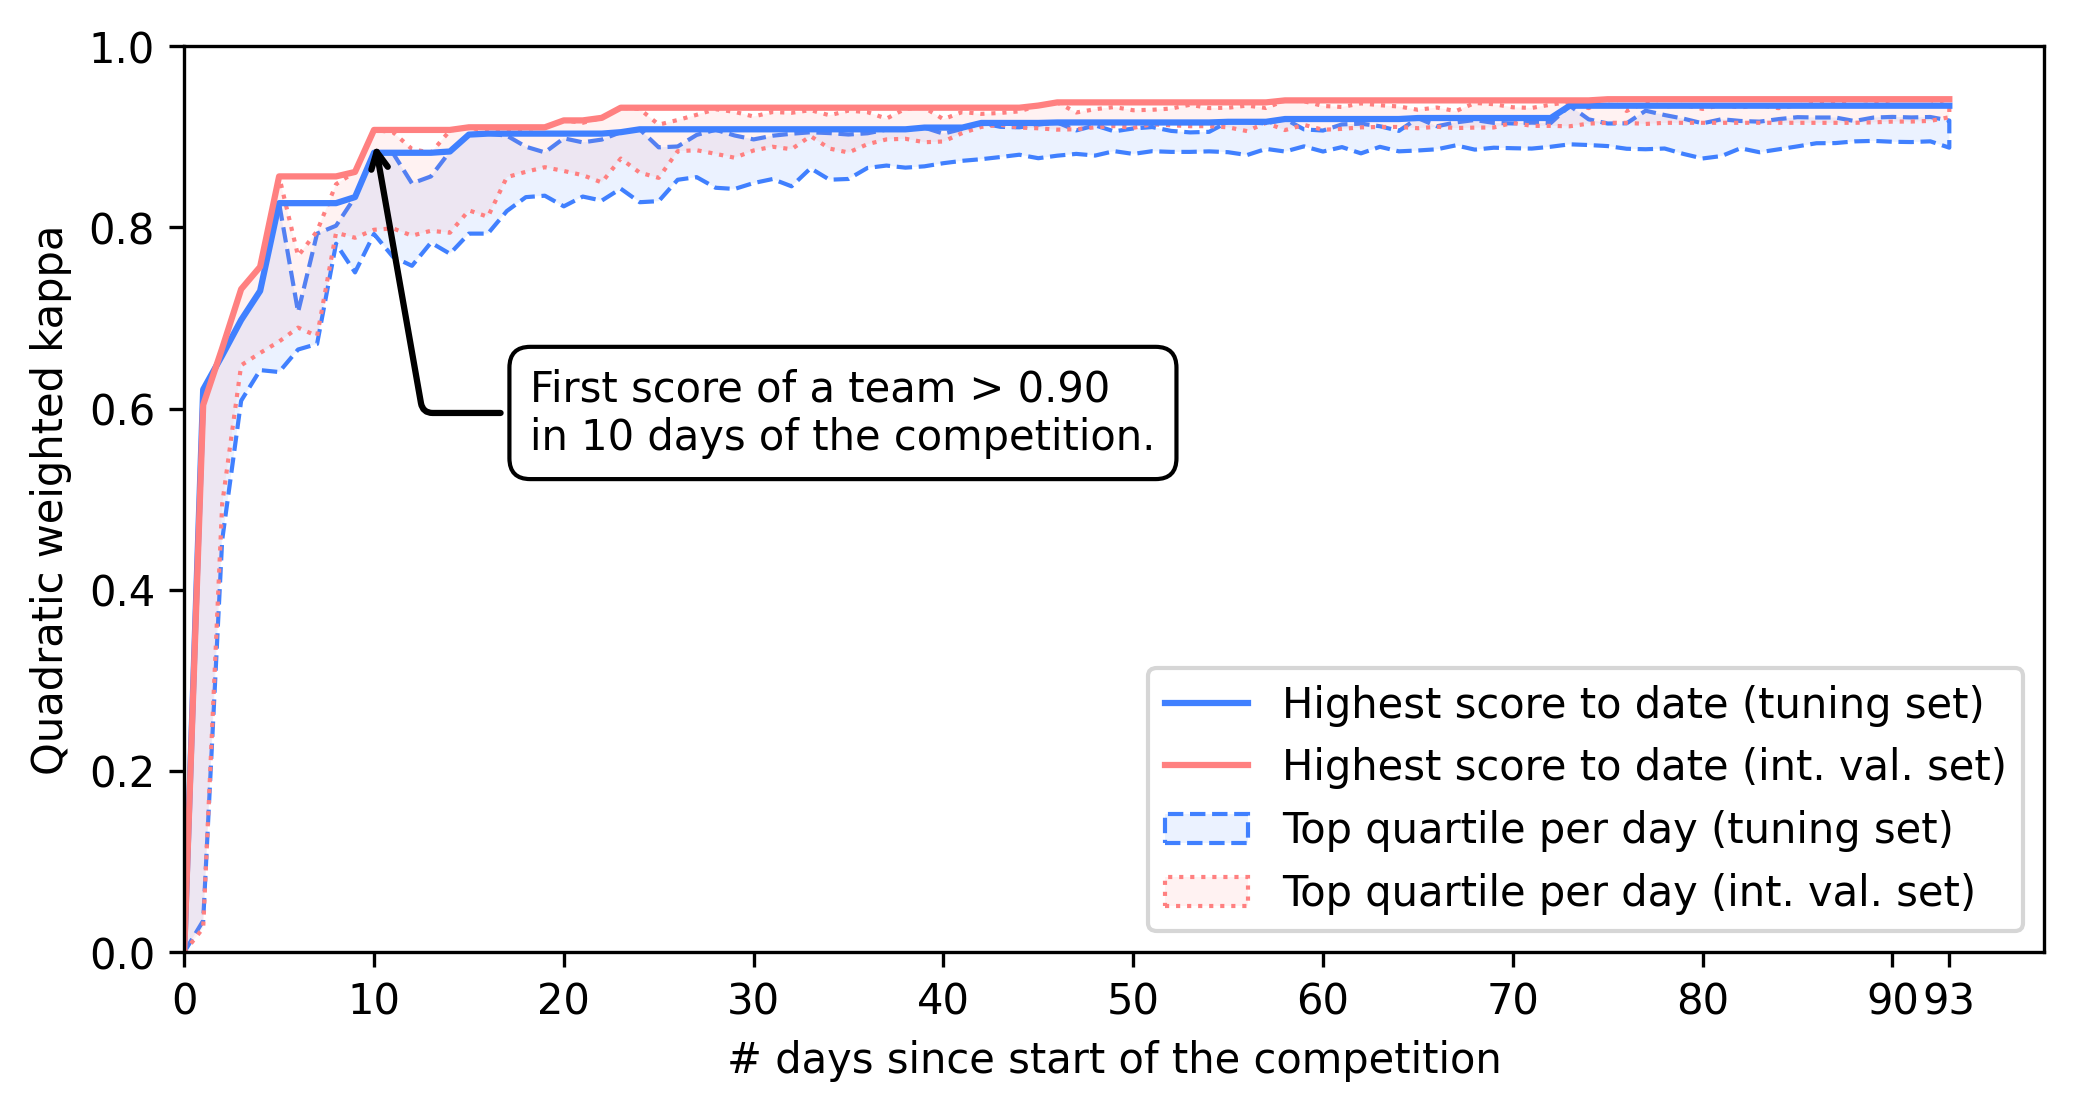
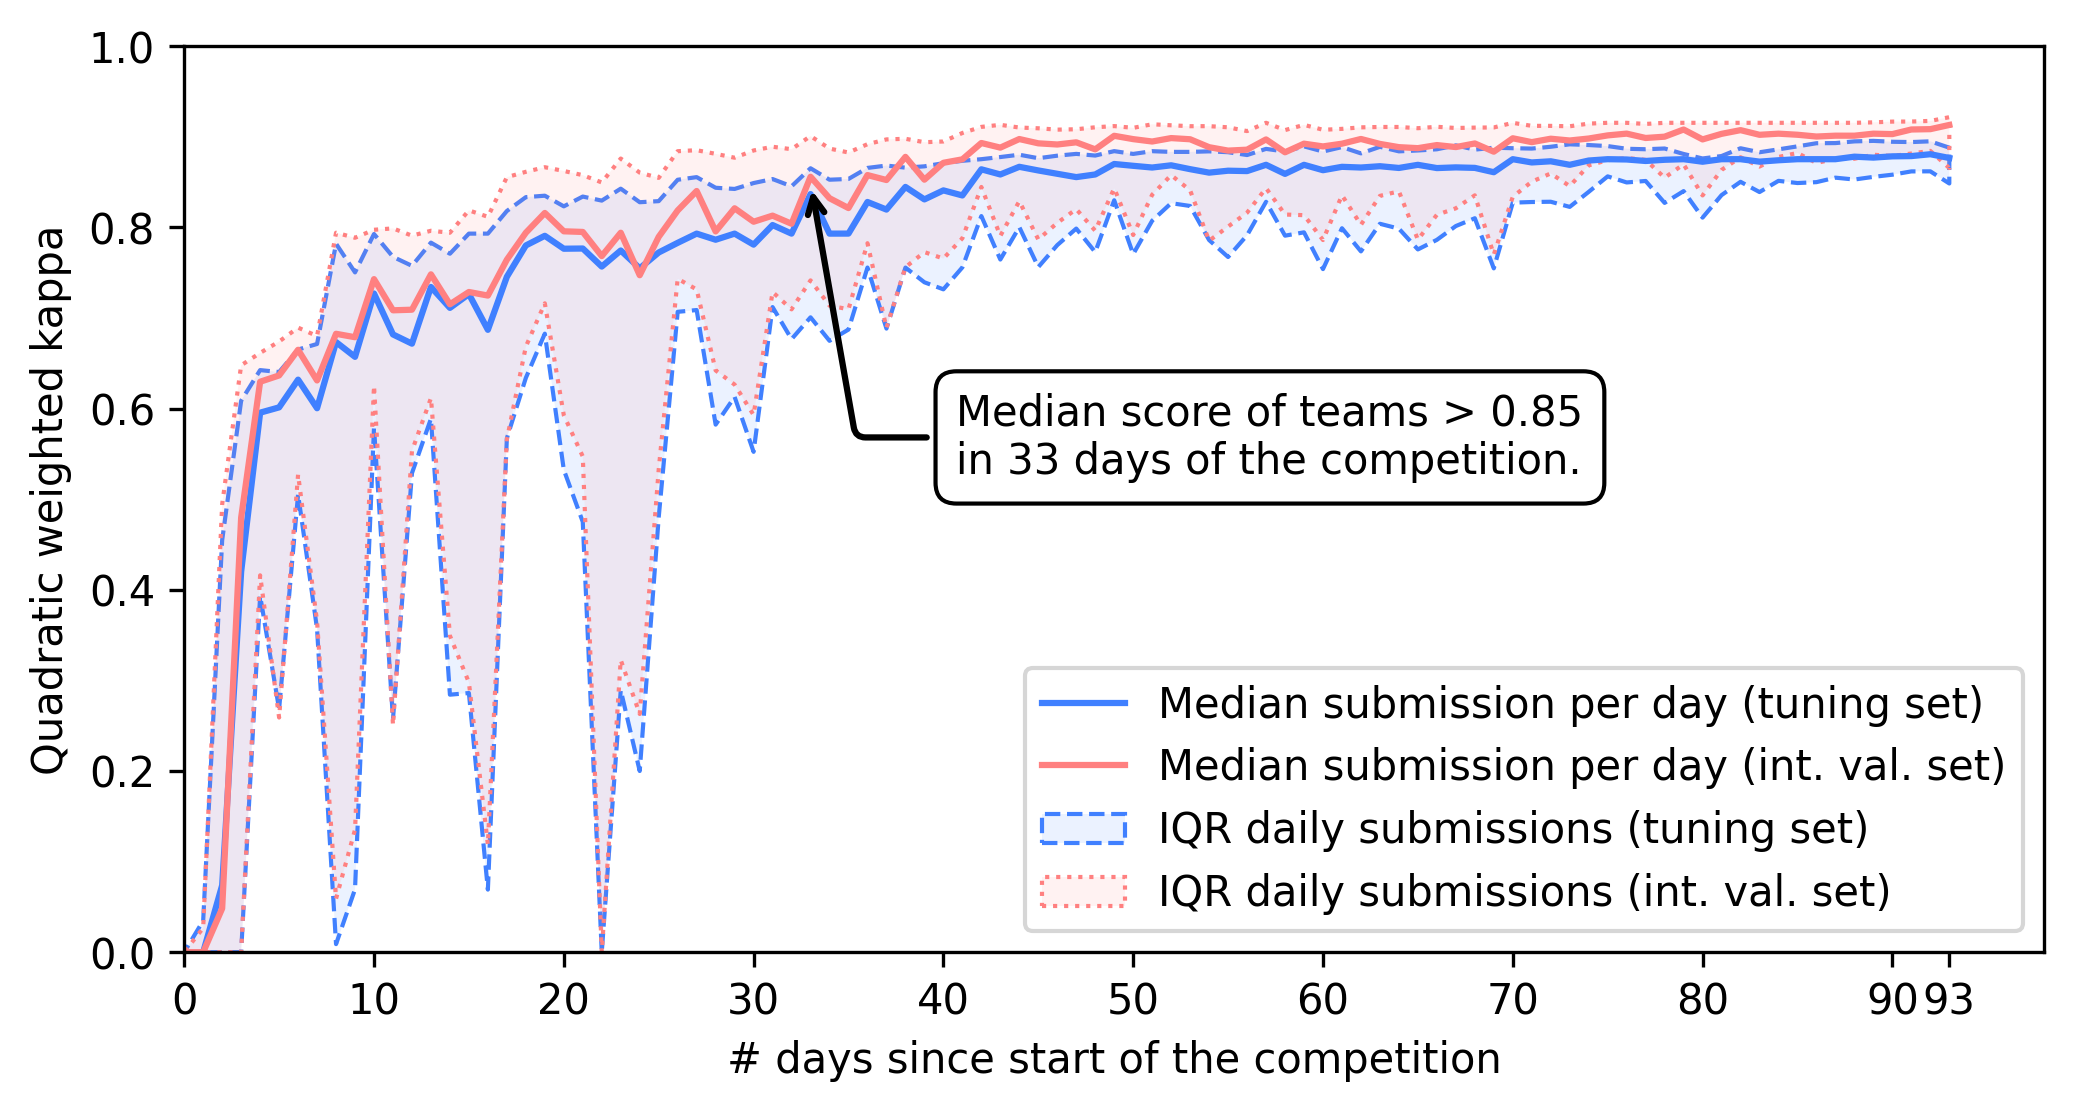
The first team achieving an agreement with the uropathologists of above 0.90 (quadratically weighted Cohen’s kappa) on the internal validation set already occurred within the first 10 days of the competition (Figure 4.2a). In 33 days of the competition, the median performance of all teams exceeded a score of 0.85 (Figure 4.2b).
Overview of evaluated algorithms
After the competition, teams were invited to join the PANDA consortium. Of all eligible teams, 33 submitted a proposal to join the validation phase of the study. From these, the competition organizers selected 15 teams based on their algorithm’s performance on the internal validation set and method description (Supplementary Methods Methods to select the 15 teams for external validation). Among the 10 highest-ranking teams in the competition, 8 submitted a proposal and were accepted to join the consortium. The further 7 teams in the consortium all ranked within the competition’s top 30.
All selected algorithms made use of deep learning-based methods.2122 Many of the solutions demonstrated the feasibility of end-to-end training using case-level information only,23 that is, using the ISUP grade group of a specimen as the target label for an entire WSI. Another algorithmic feature adopted by several top-performing teams was to apply automated label cleaning, where samples considered as erroneously graded by the pathologists were either excluded from training or relabeled. For a summary and details on the individual algorithms see Supplementary Methods Summary of participating teams’ methods.
Classification performance in the internal validation dataset
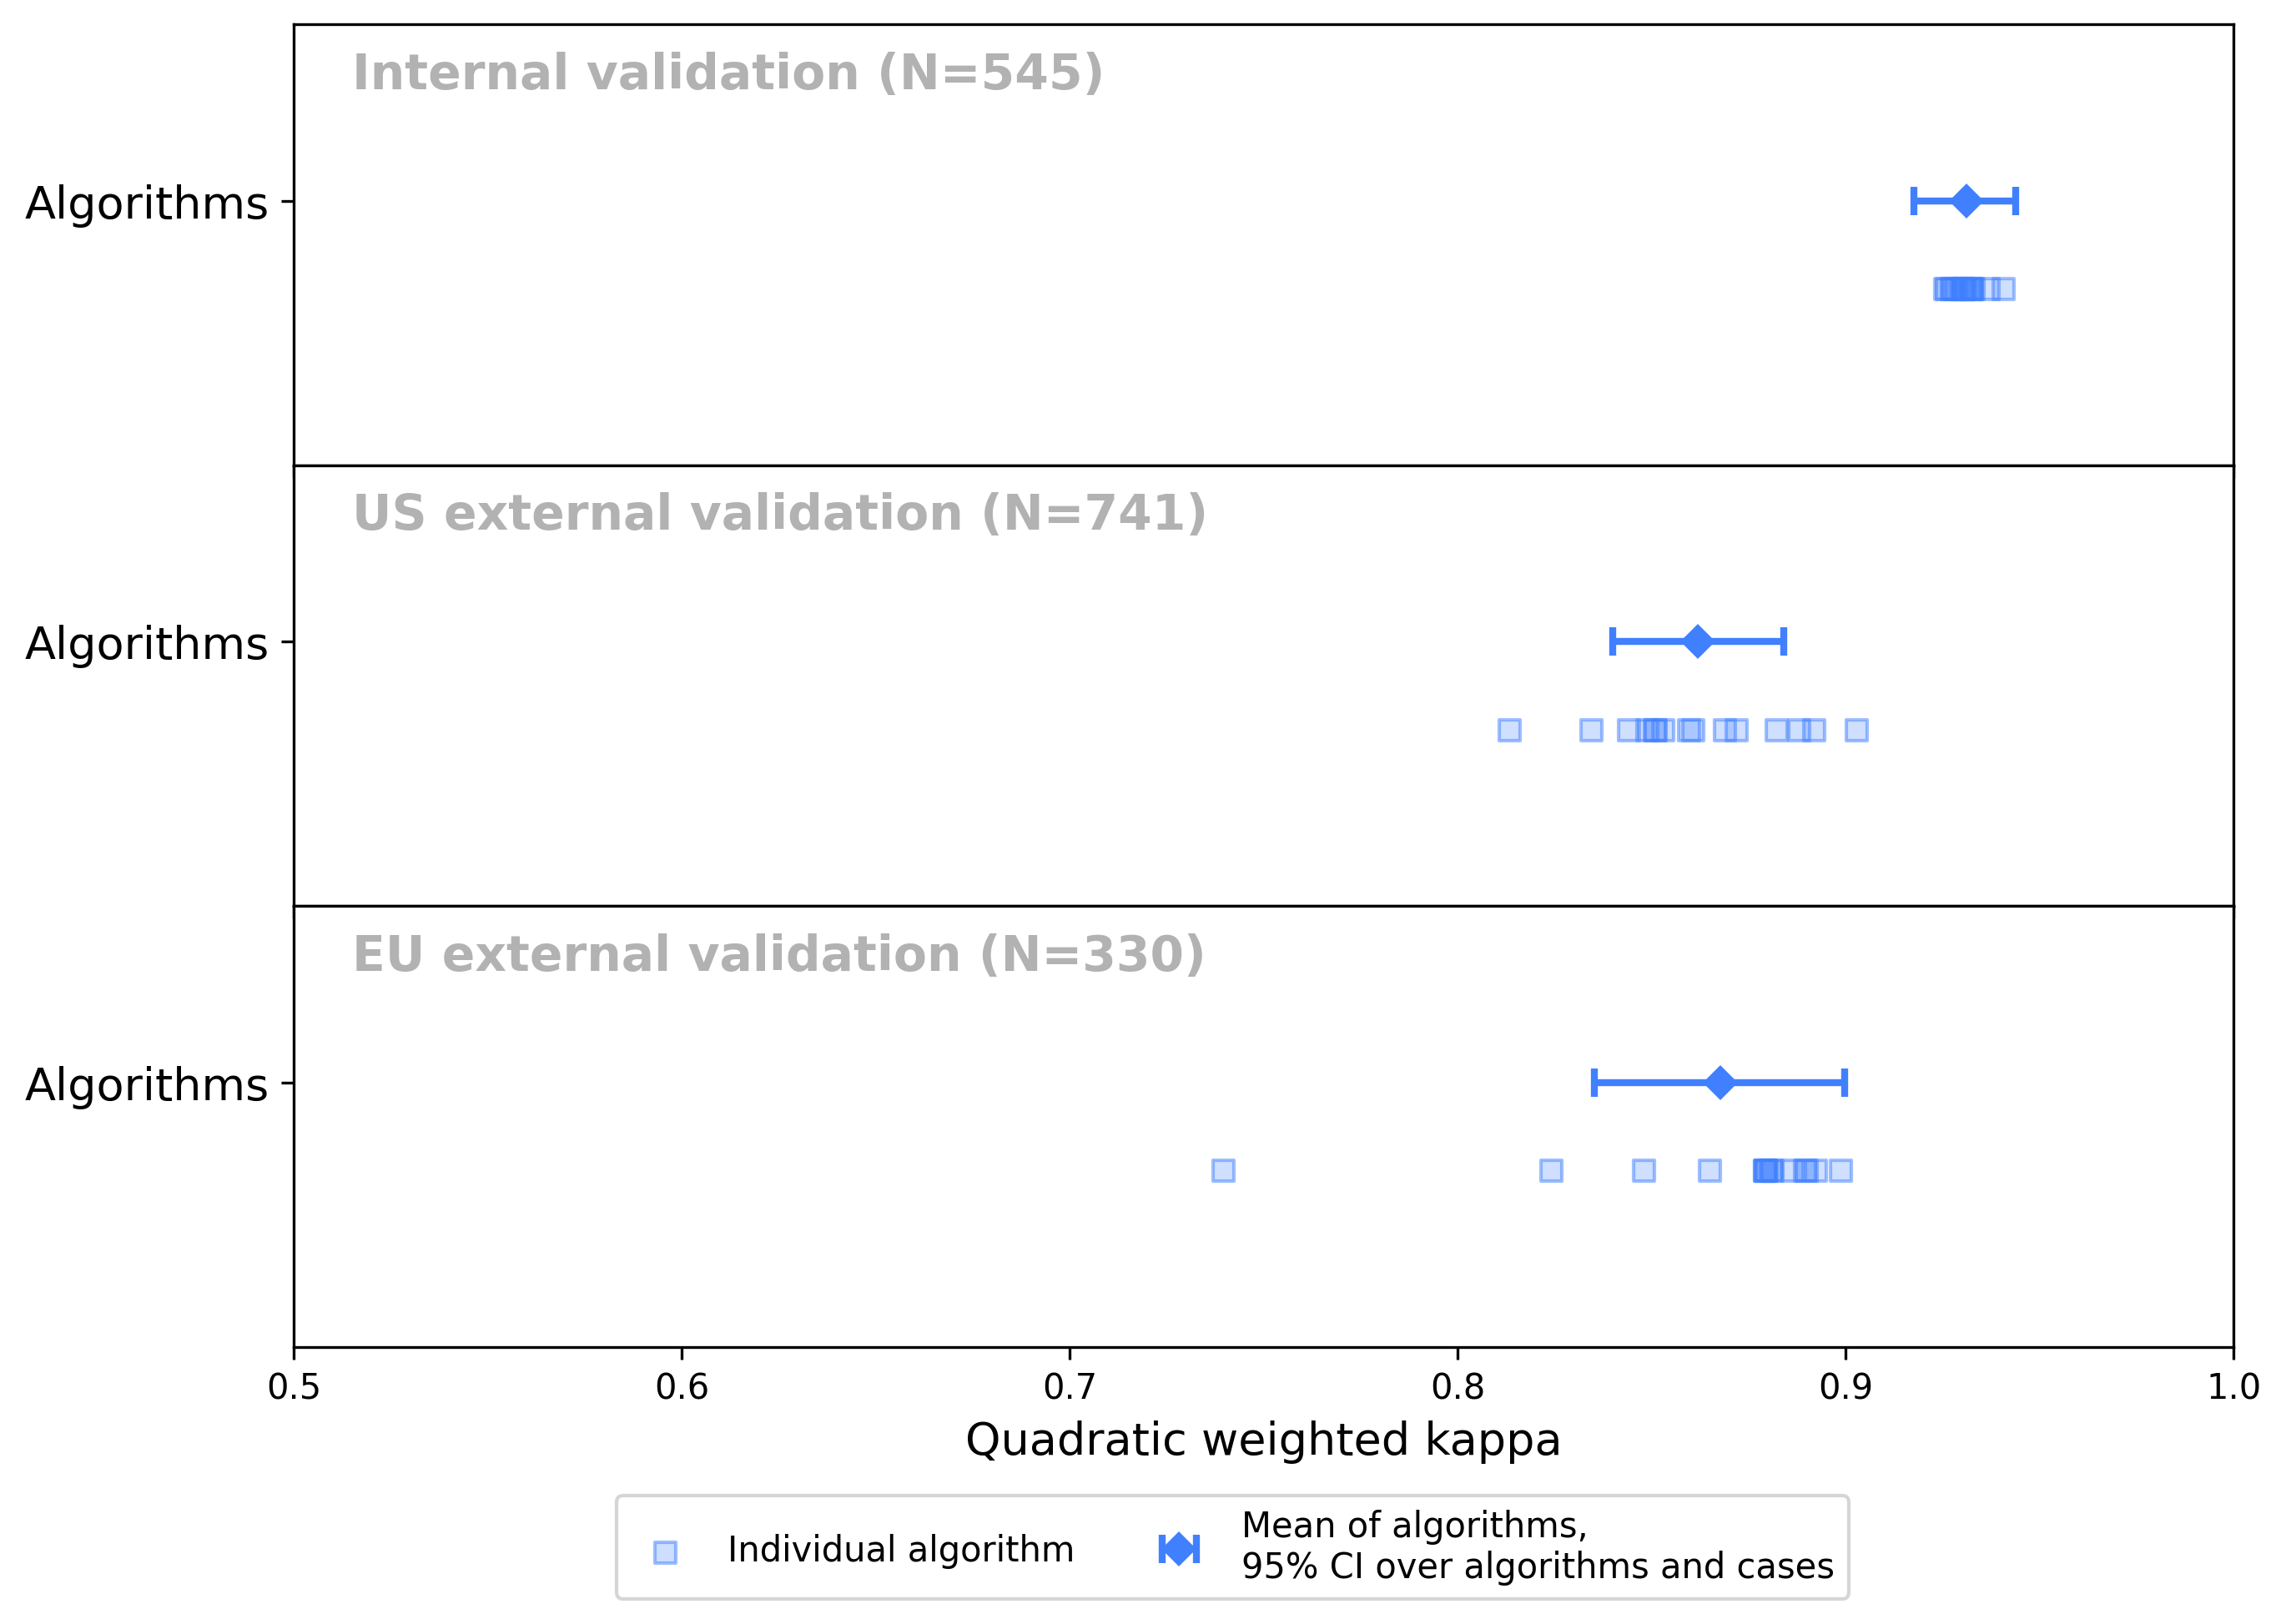
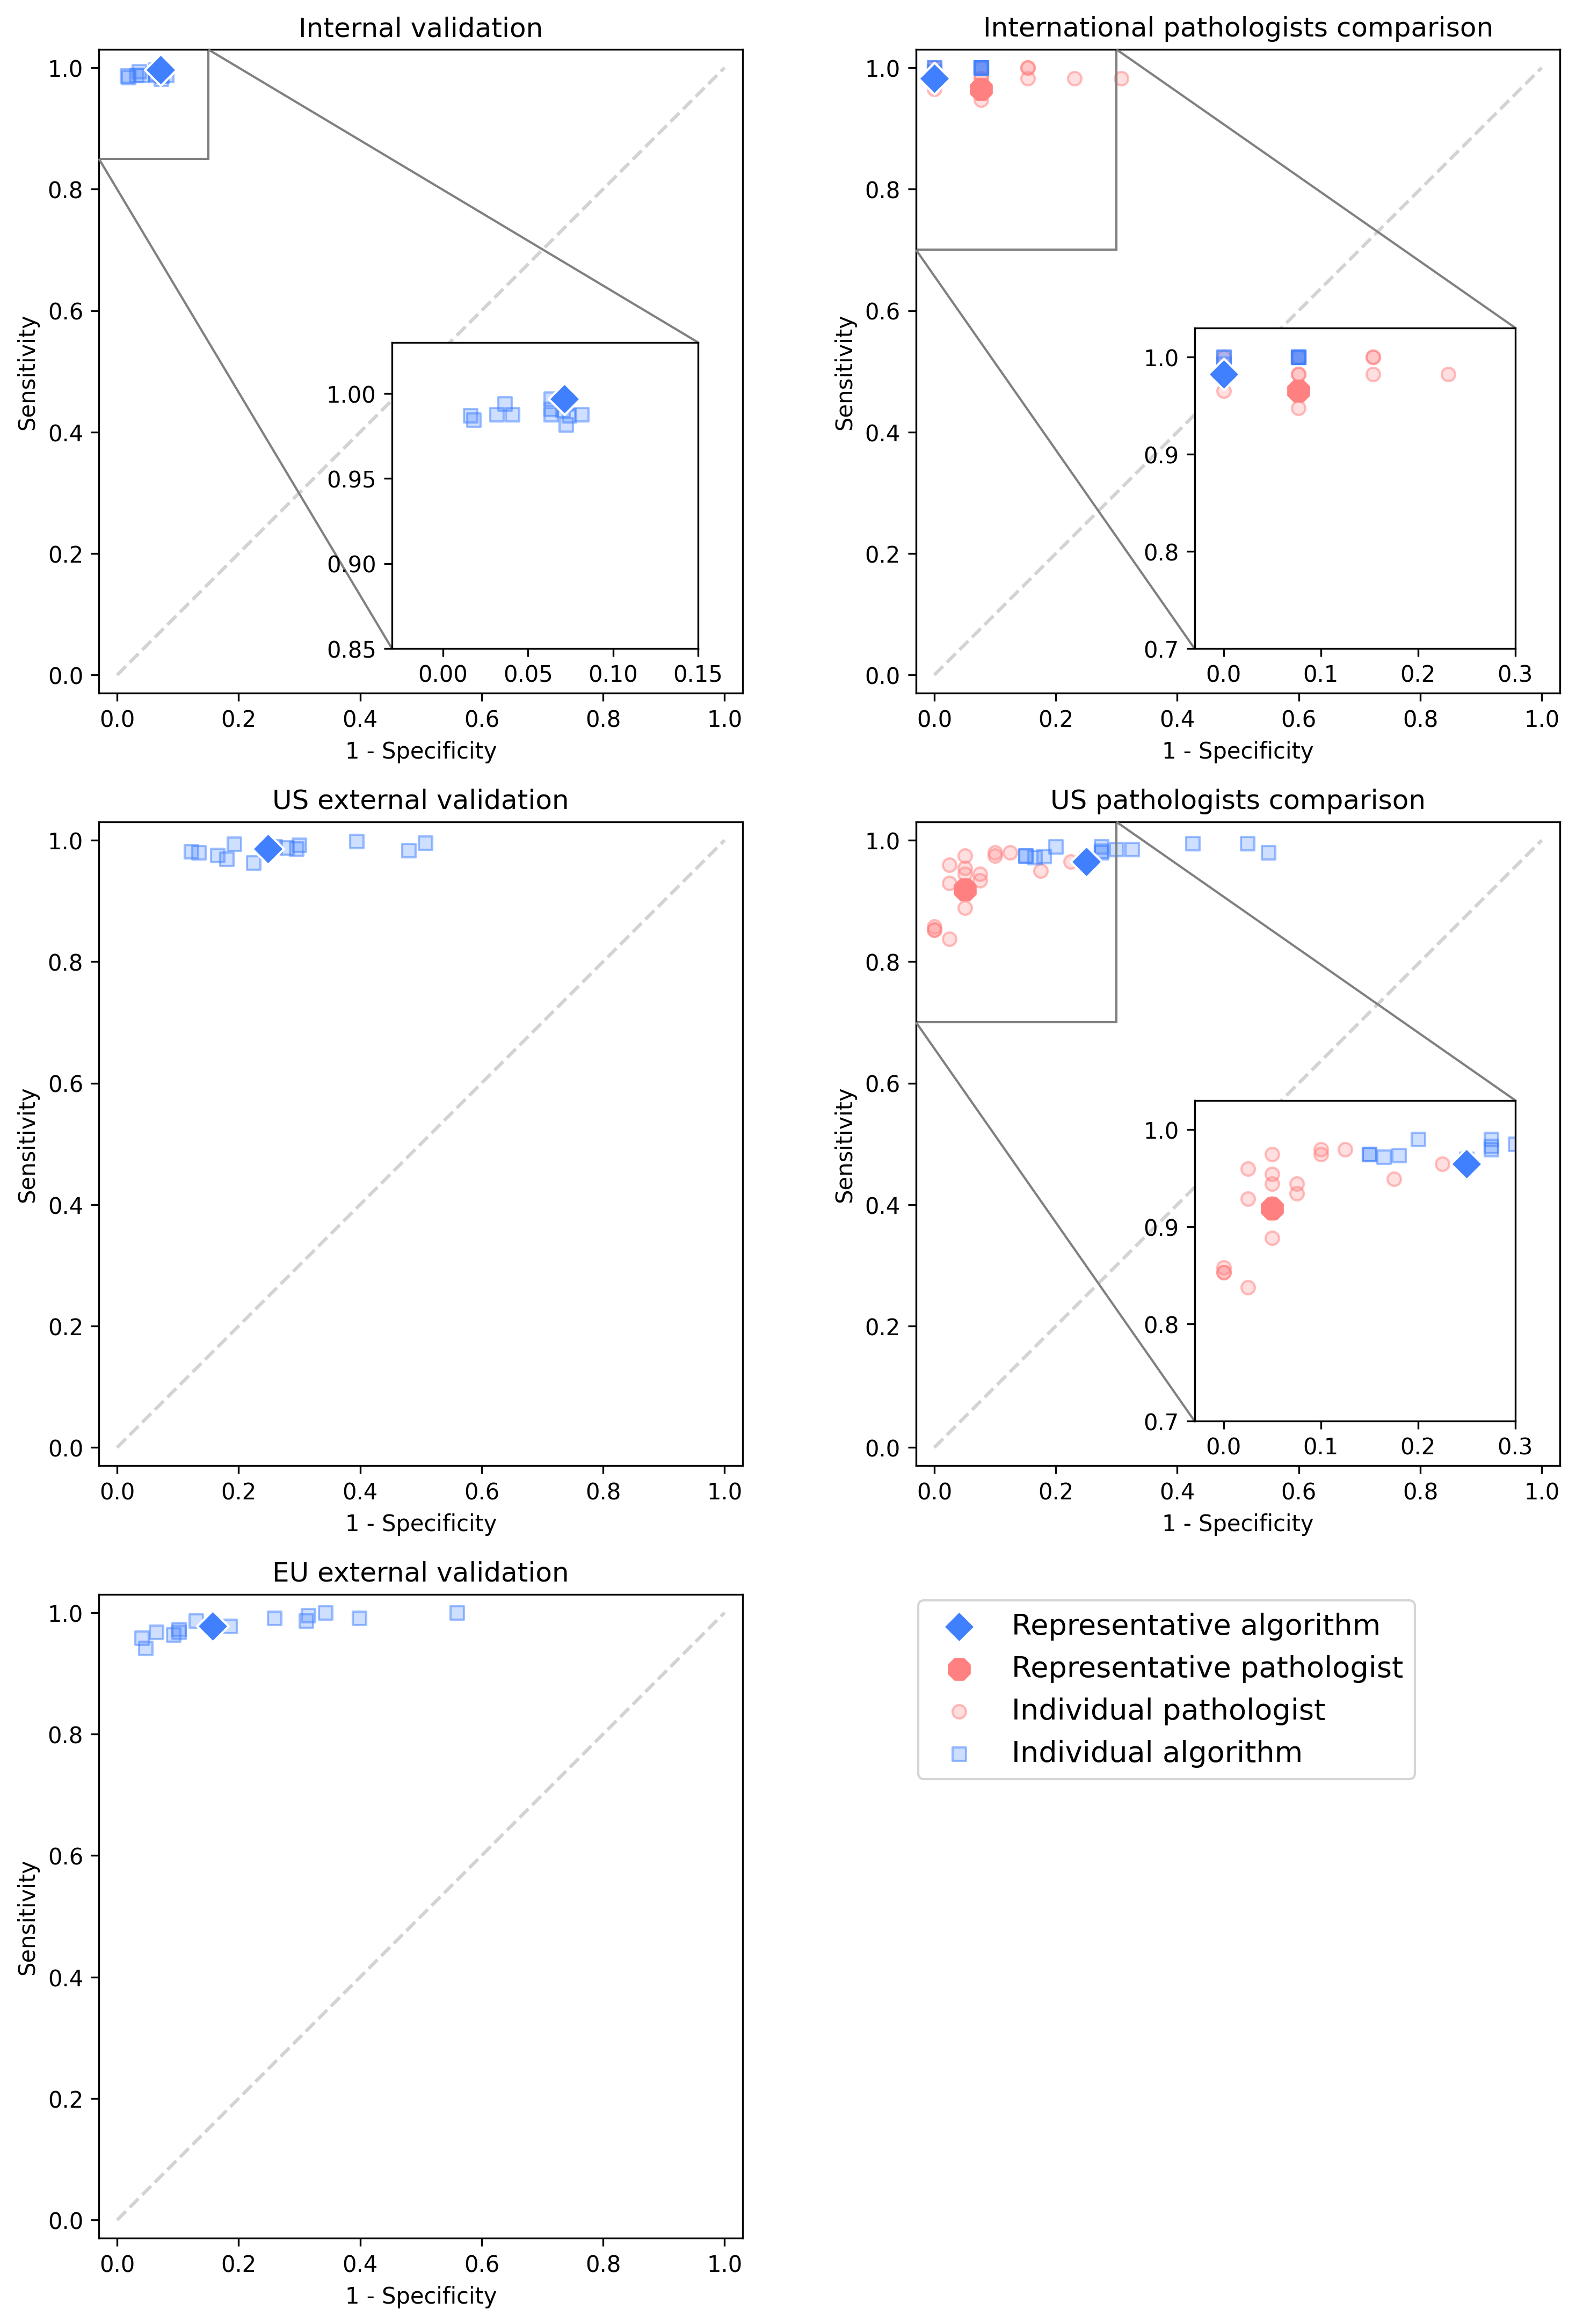
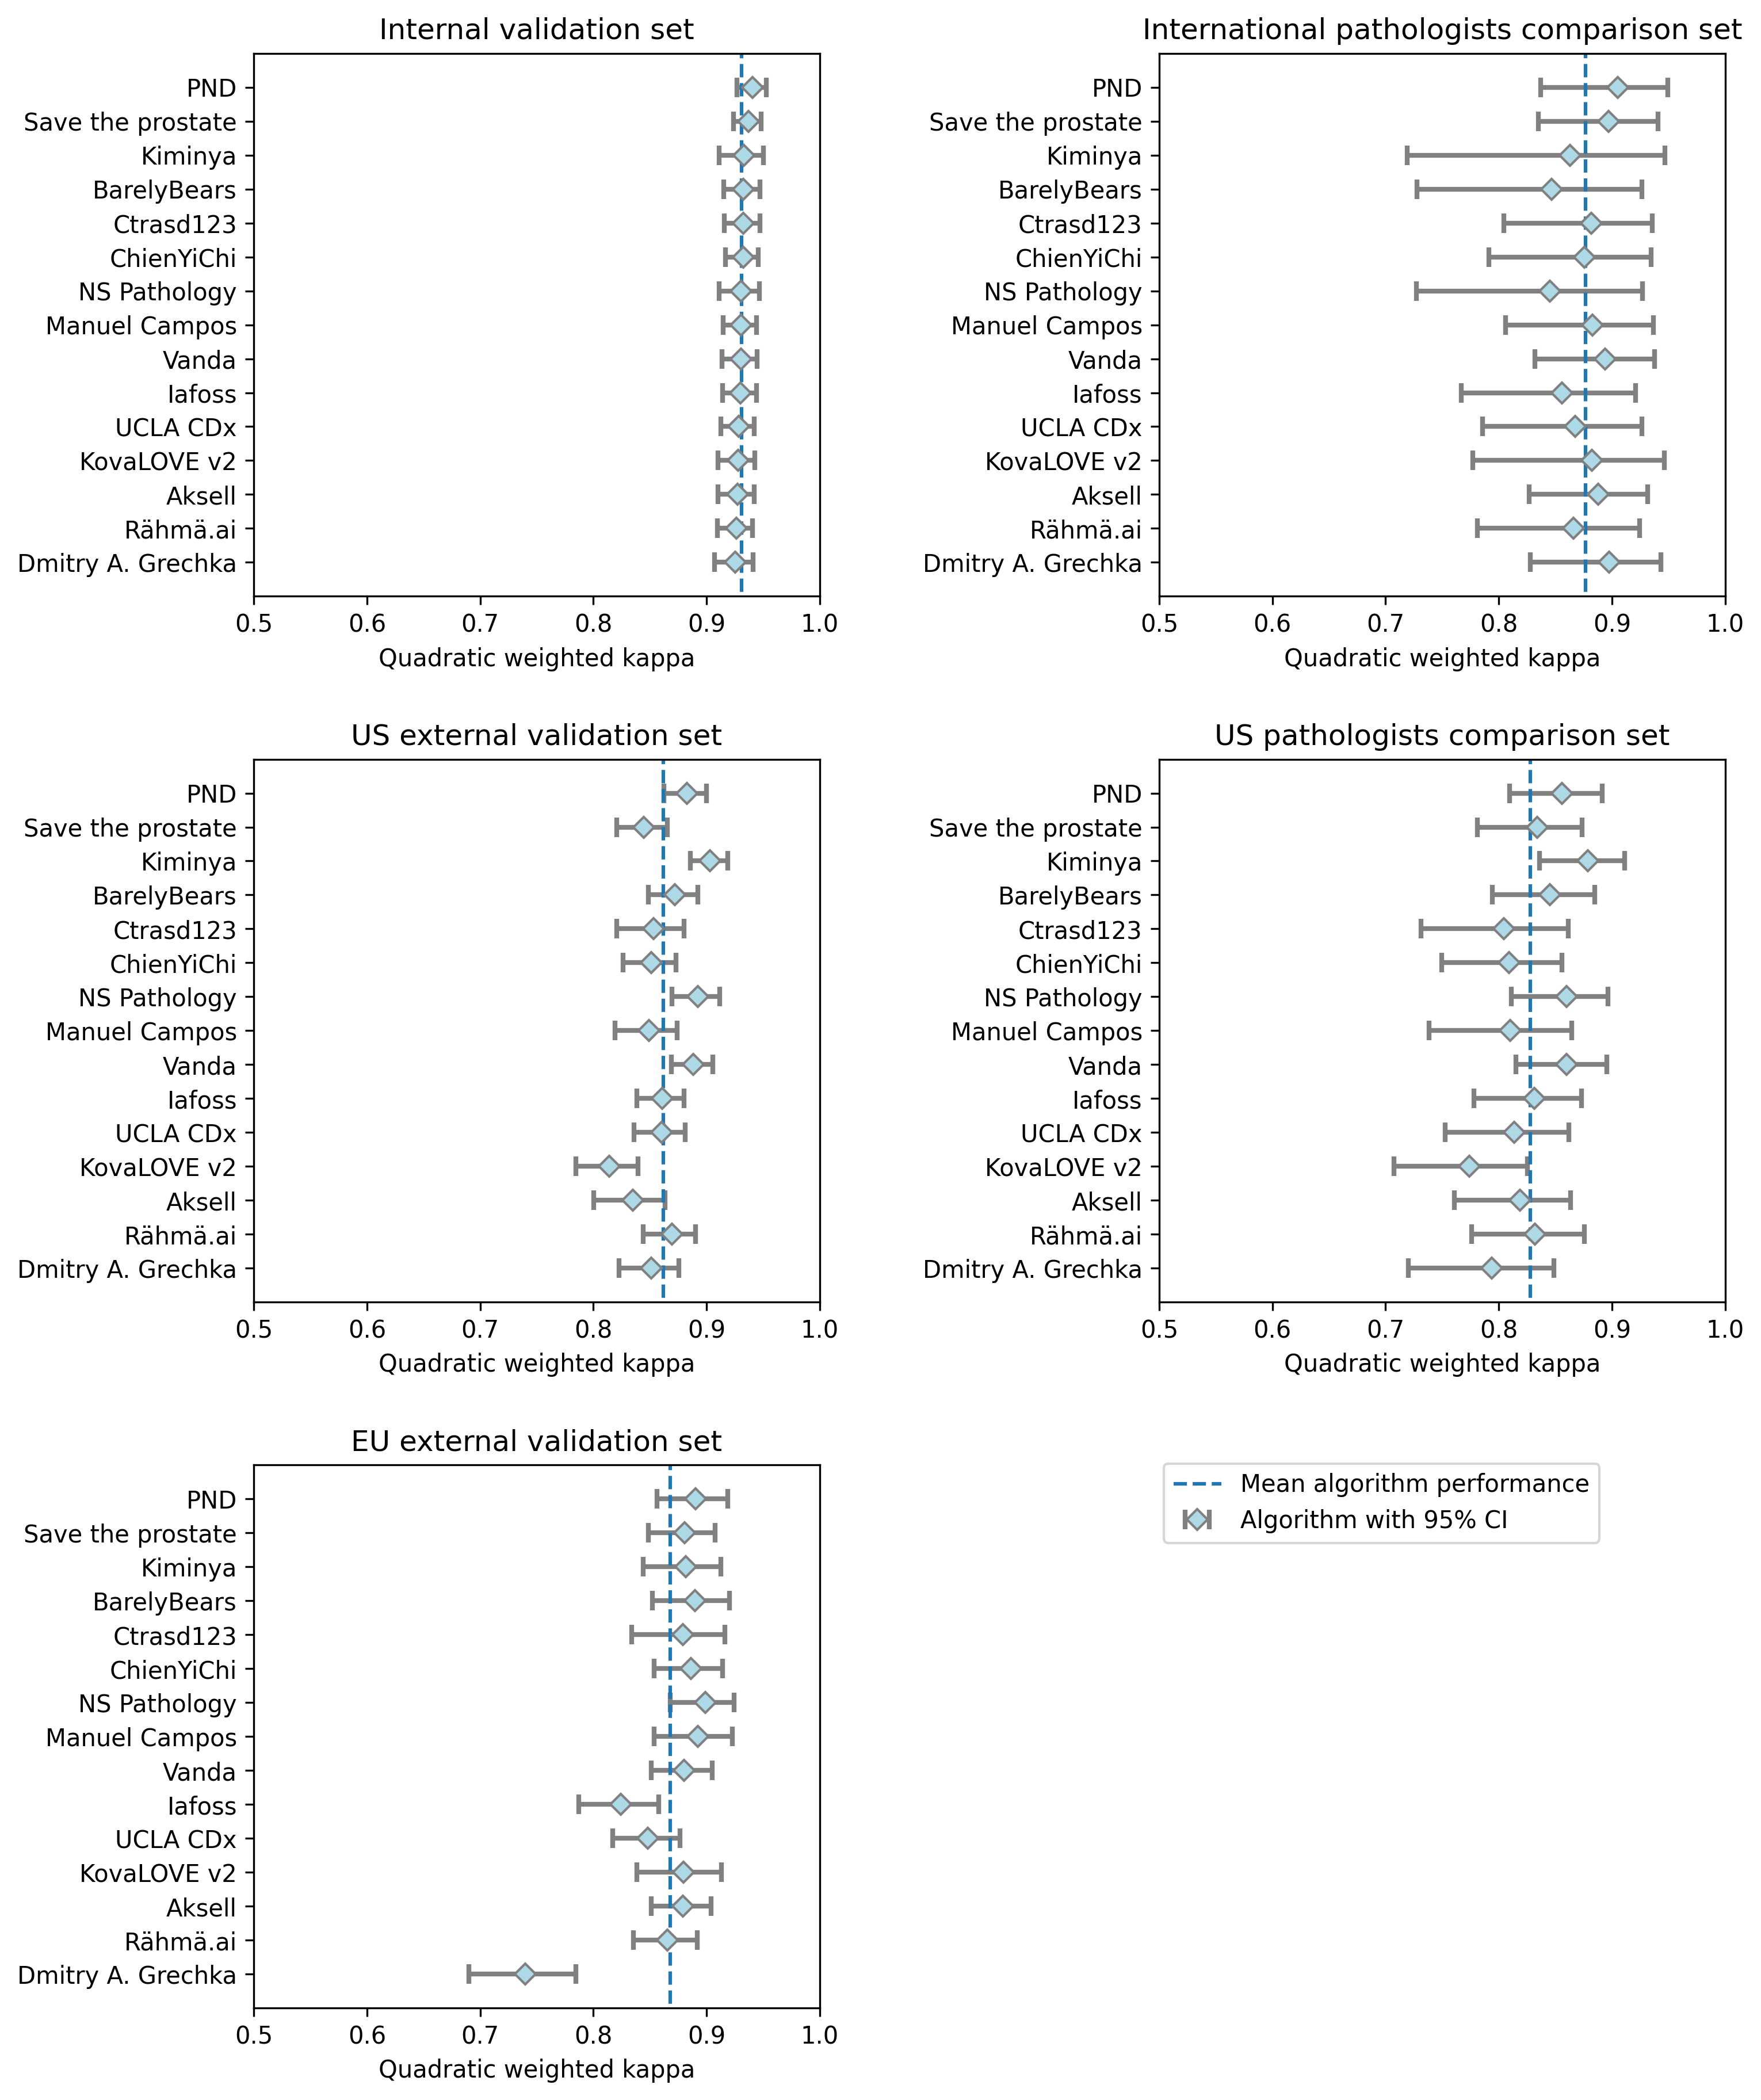
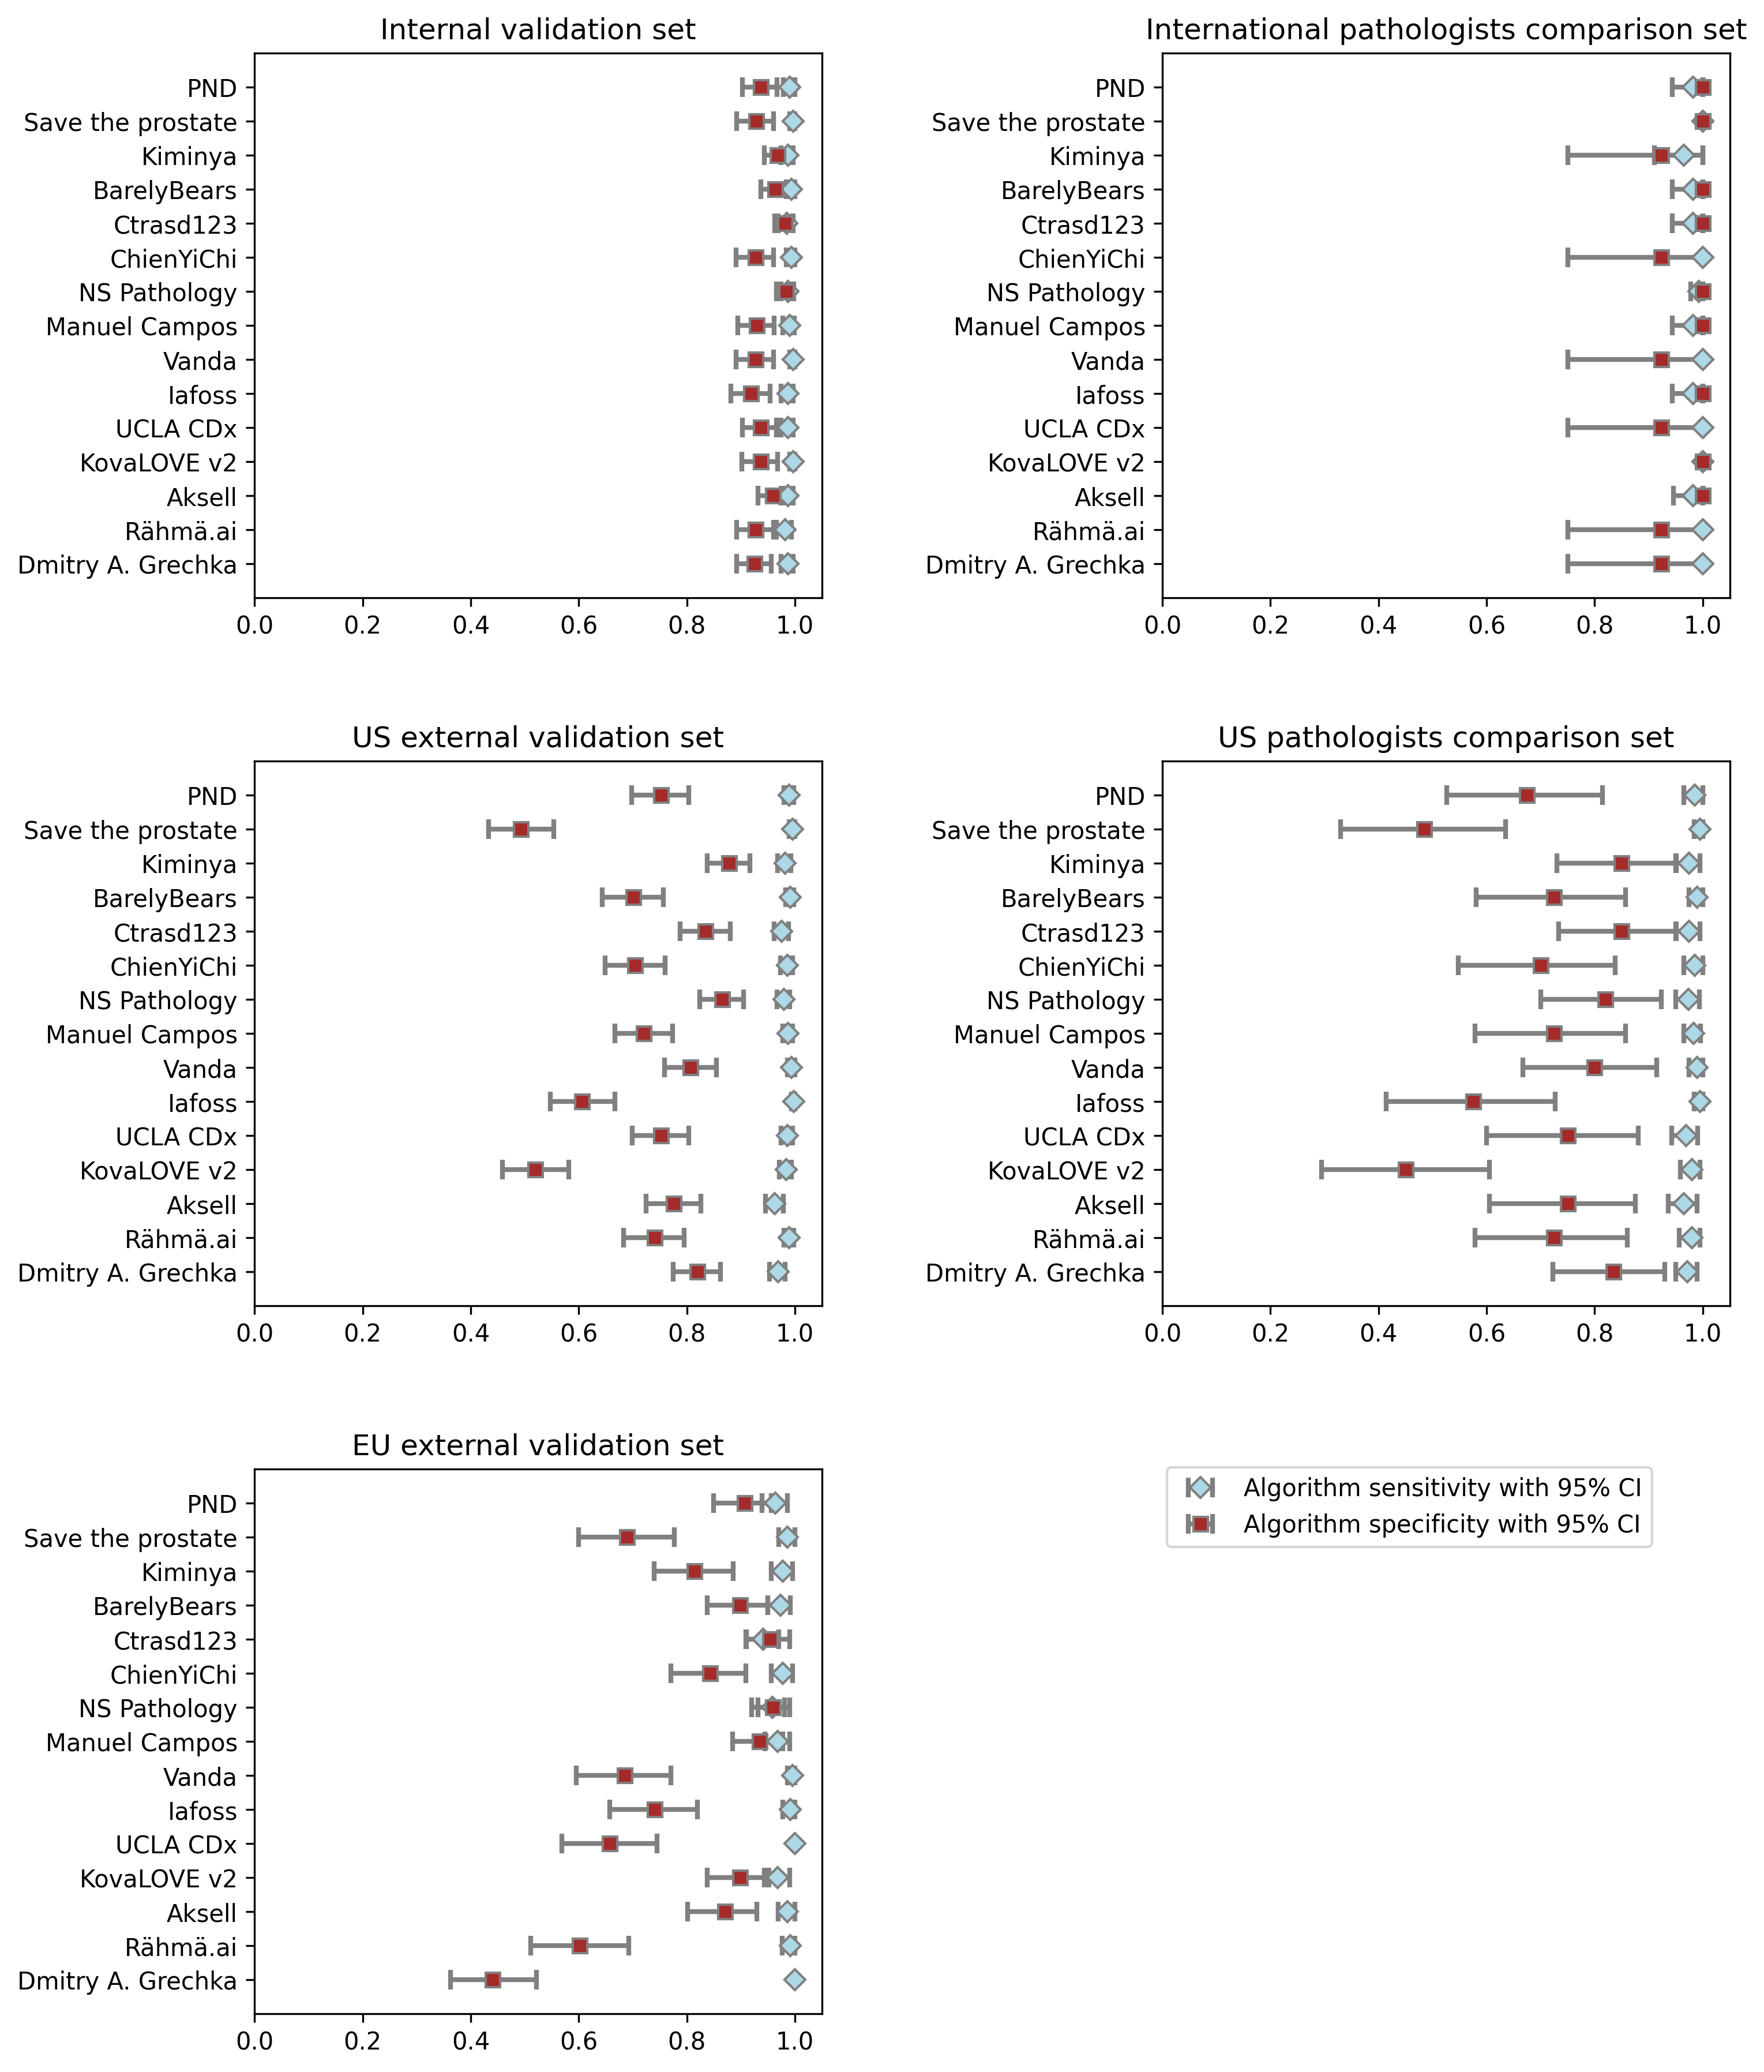
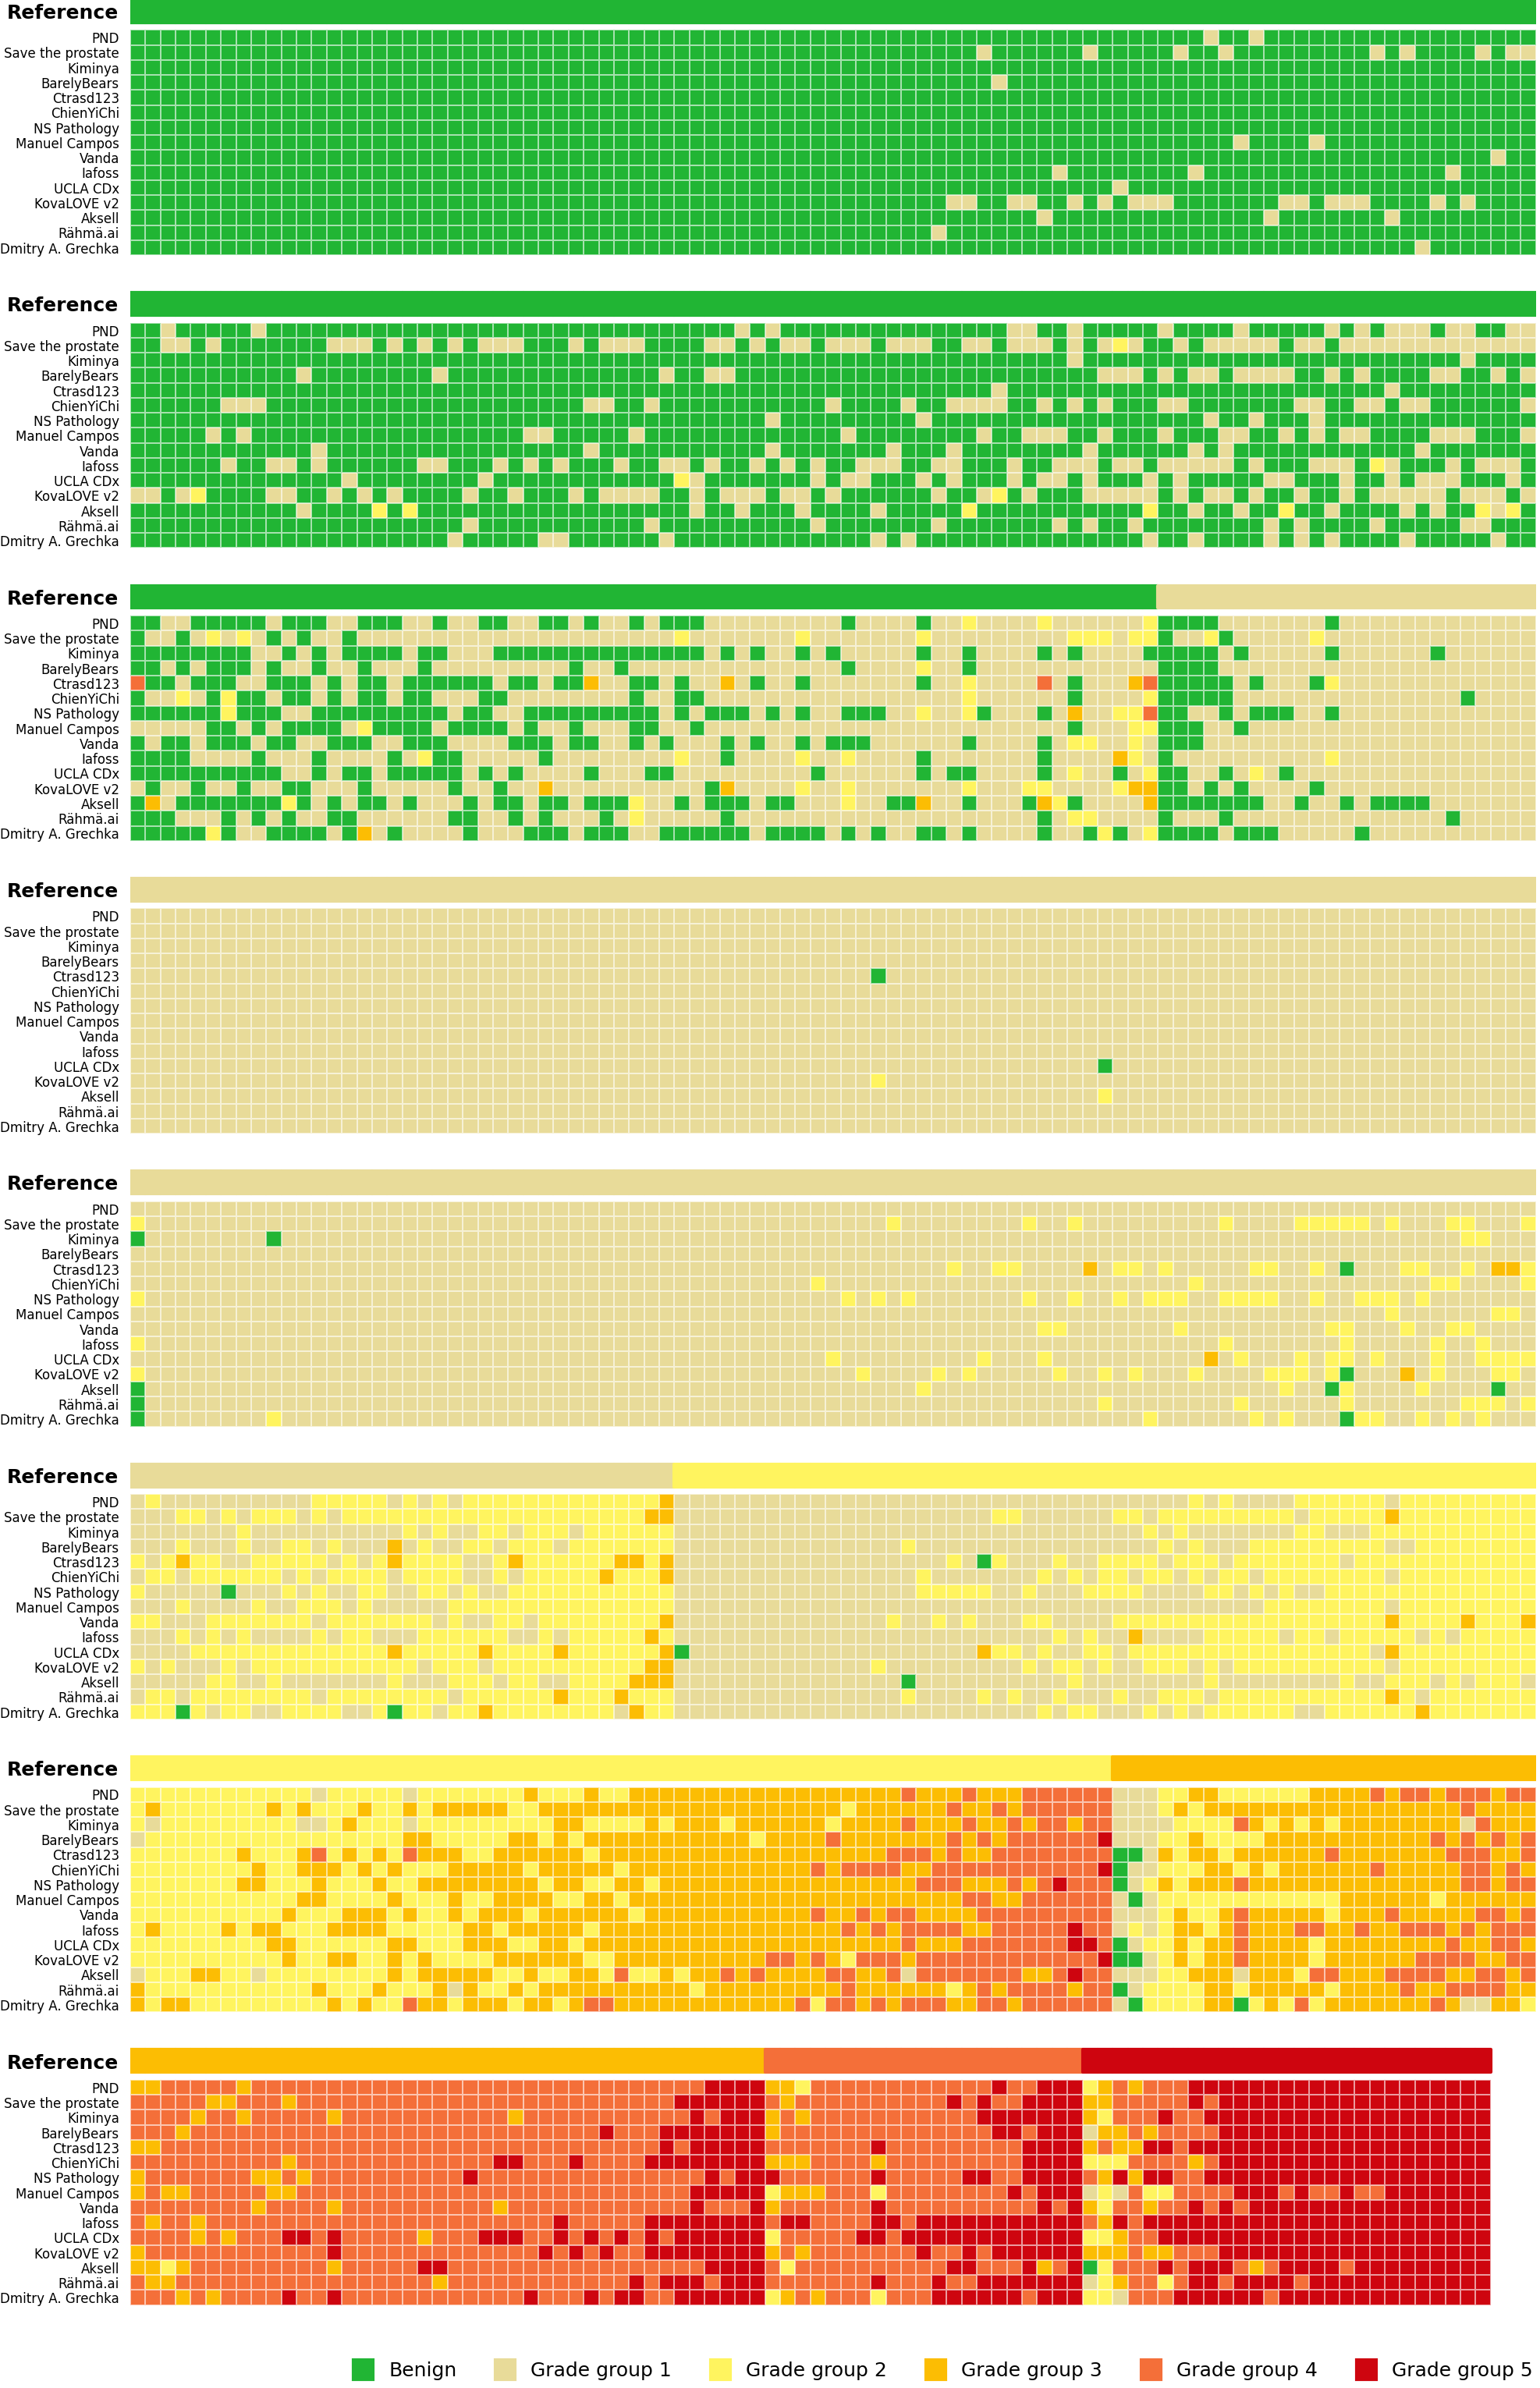
In the validation phase, all selected algorithms were fully reproduced on two separate computing platforms. The average agreement of the selected algorithms with the uropathologists was high with a quadratically weighted kappa of 0.931 (95% CI, 0.918-0.944, Figure 4.4a). Algorithms showed high sensitivity for tumor detection, with the representative algorithm (see Methods) achieving a sensitivity of 99.7% (95% CI, 98.1-99.7, Figure 4.5) and a specificity of 92.9% (95% CI, 91.9-96.7). The classification performances of the individual algorithms are presented in Supplementary Figures 5, 6 and 7.
Classification performance in the external validation datasets
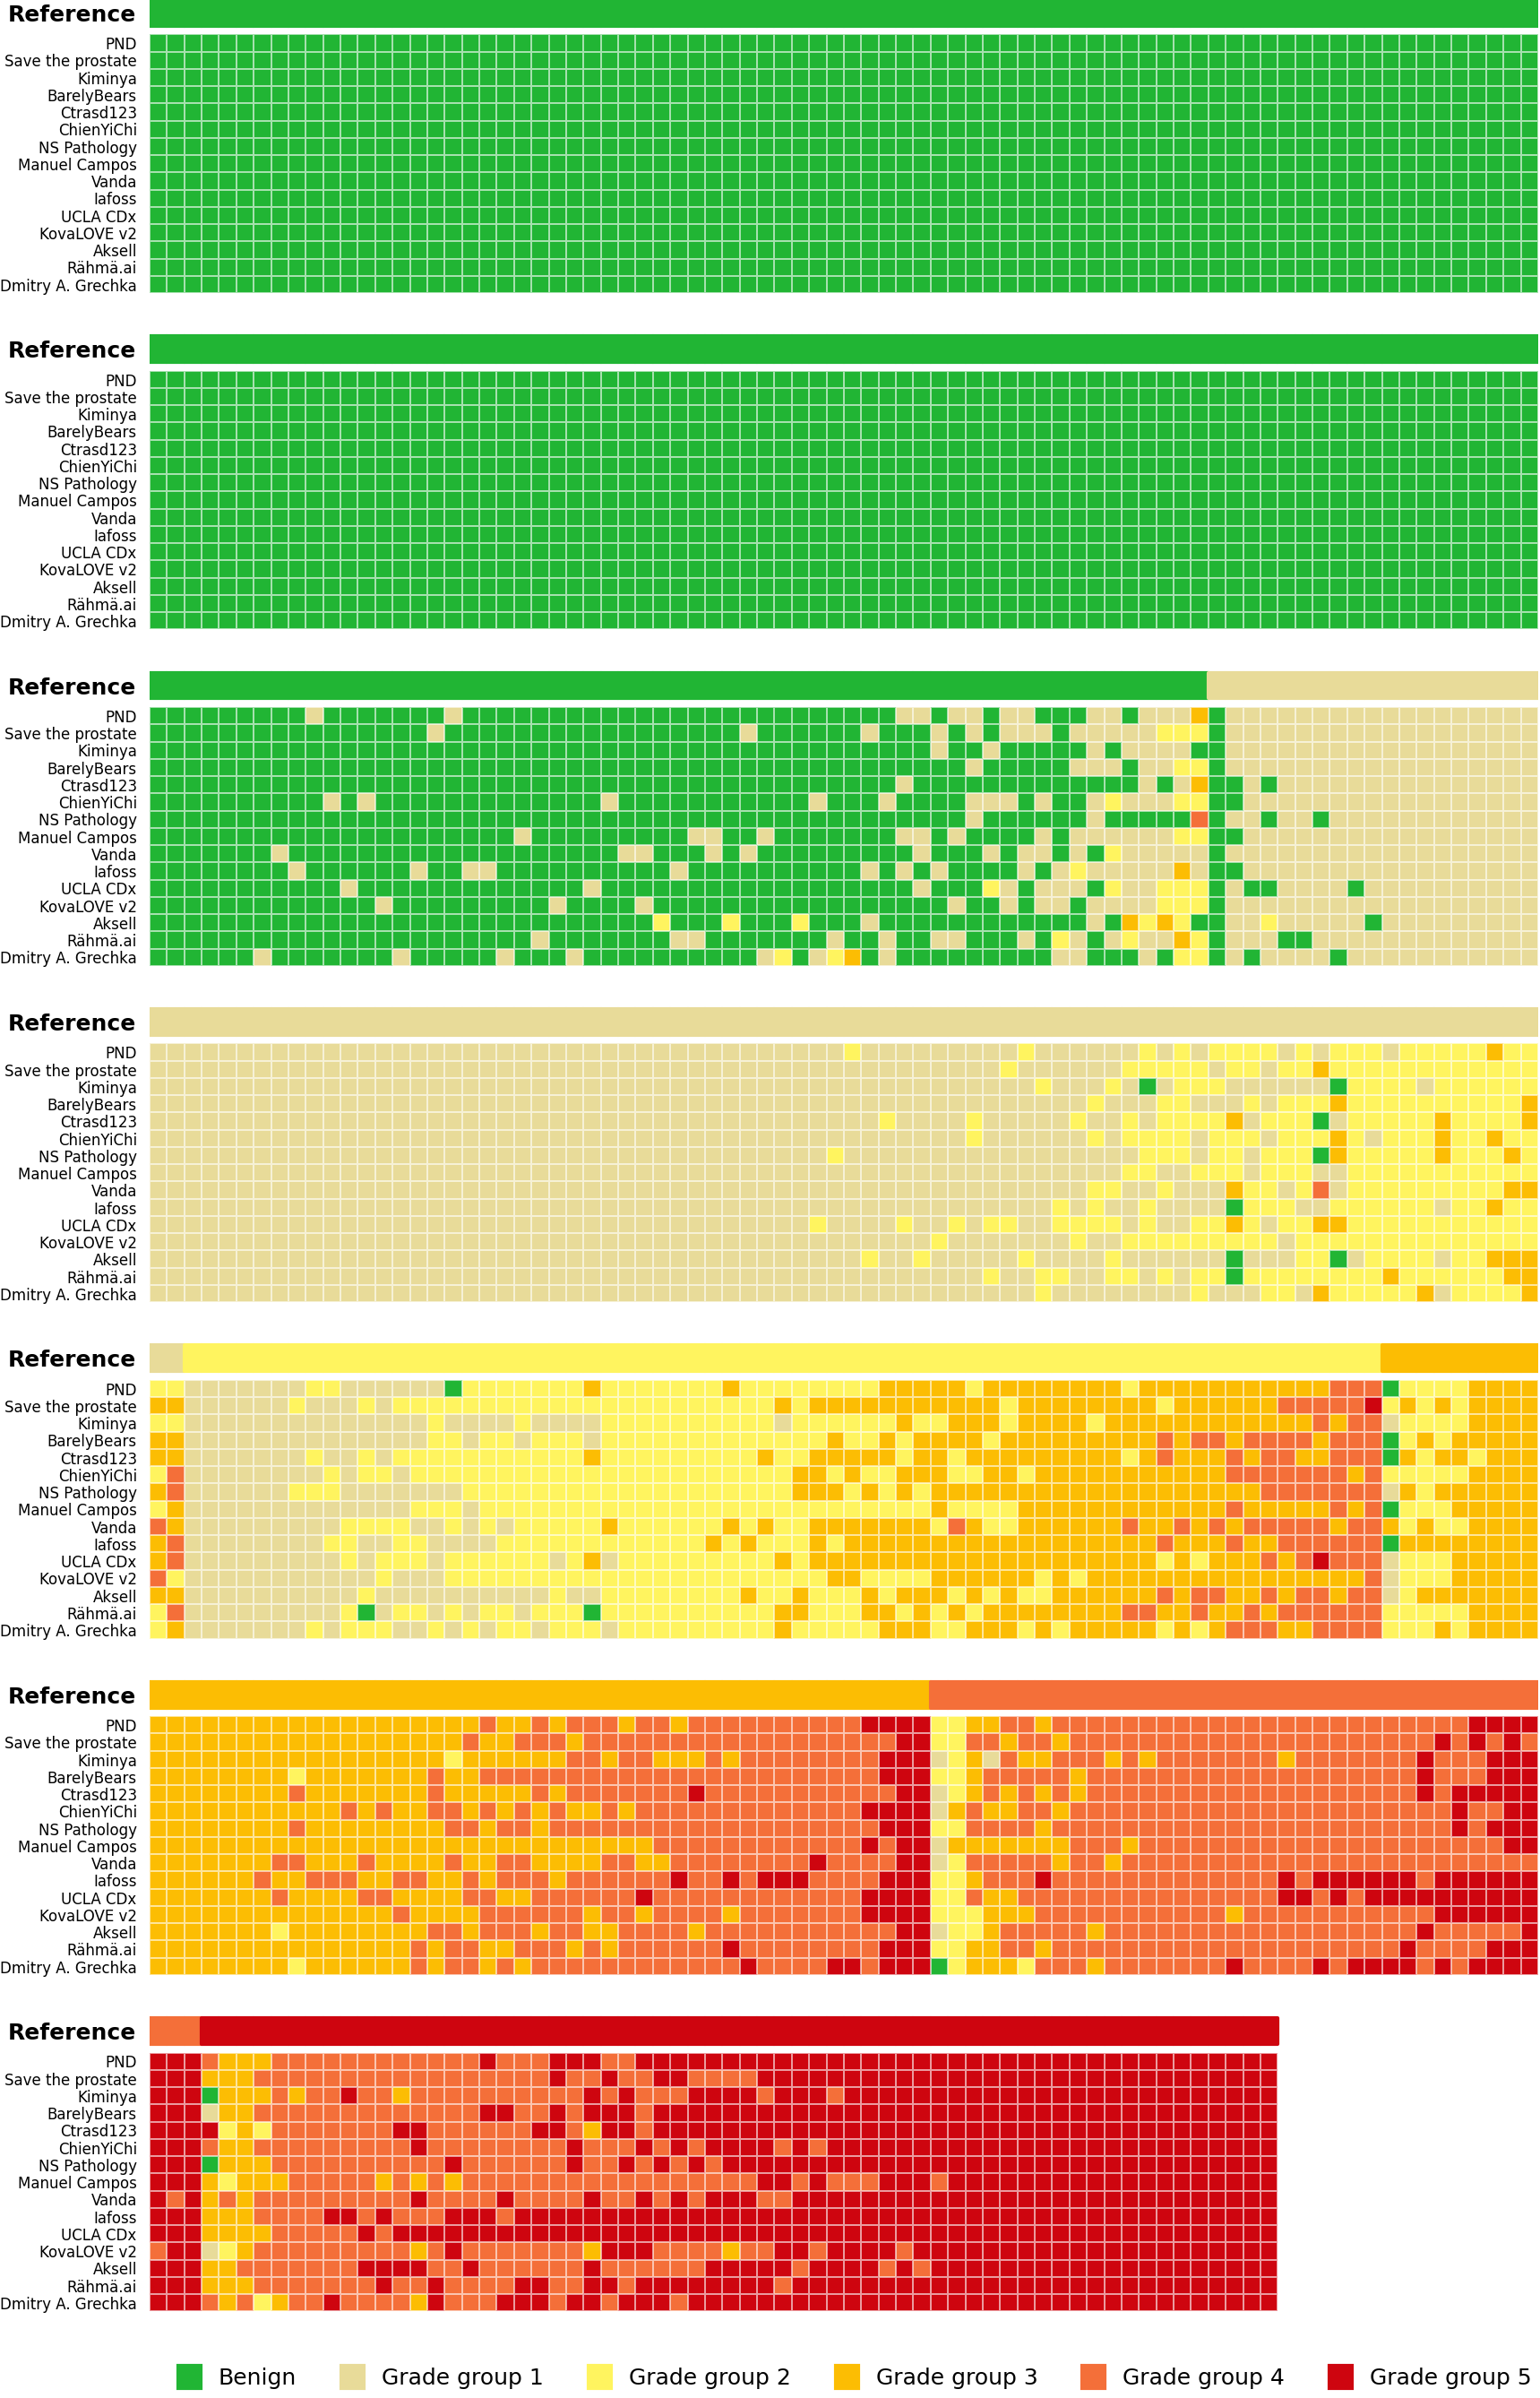
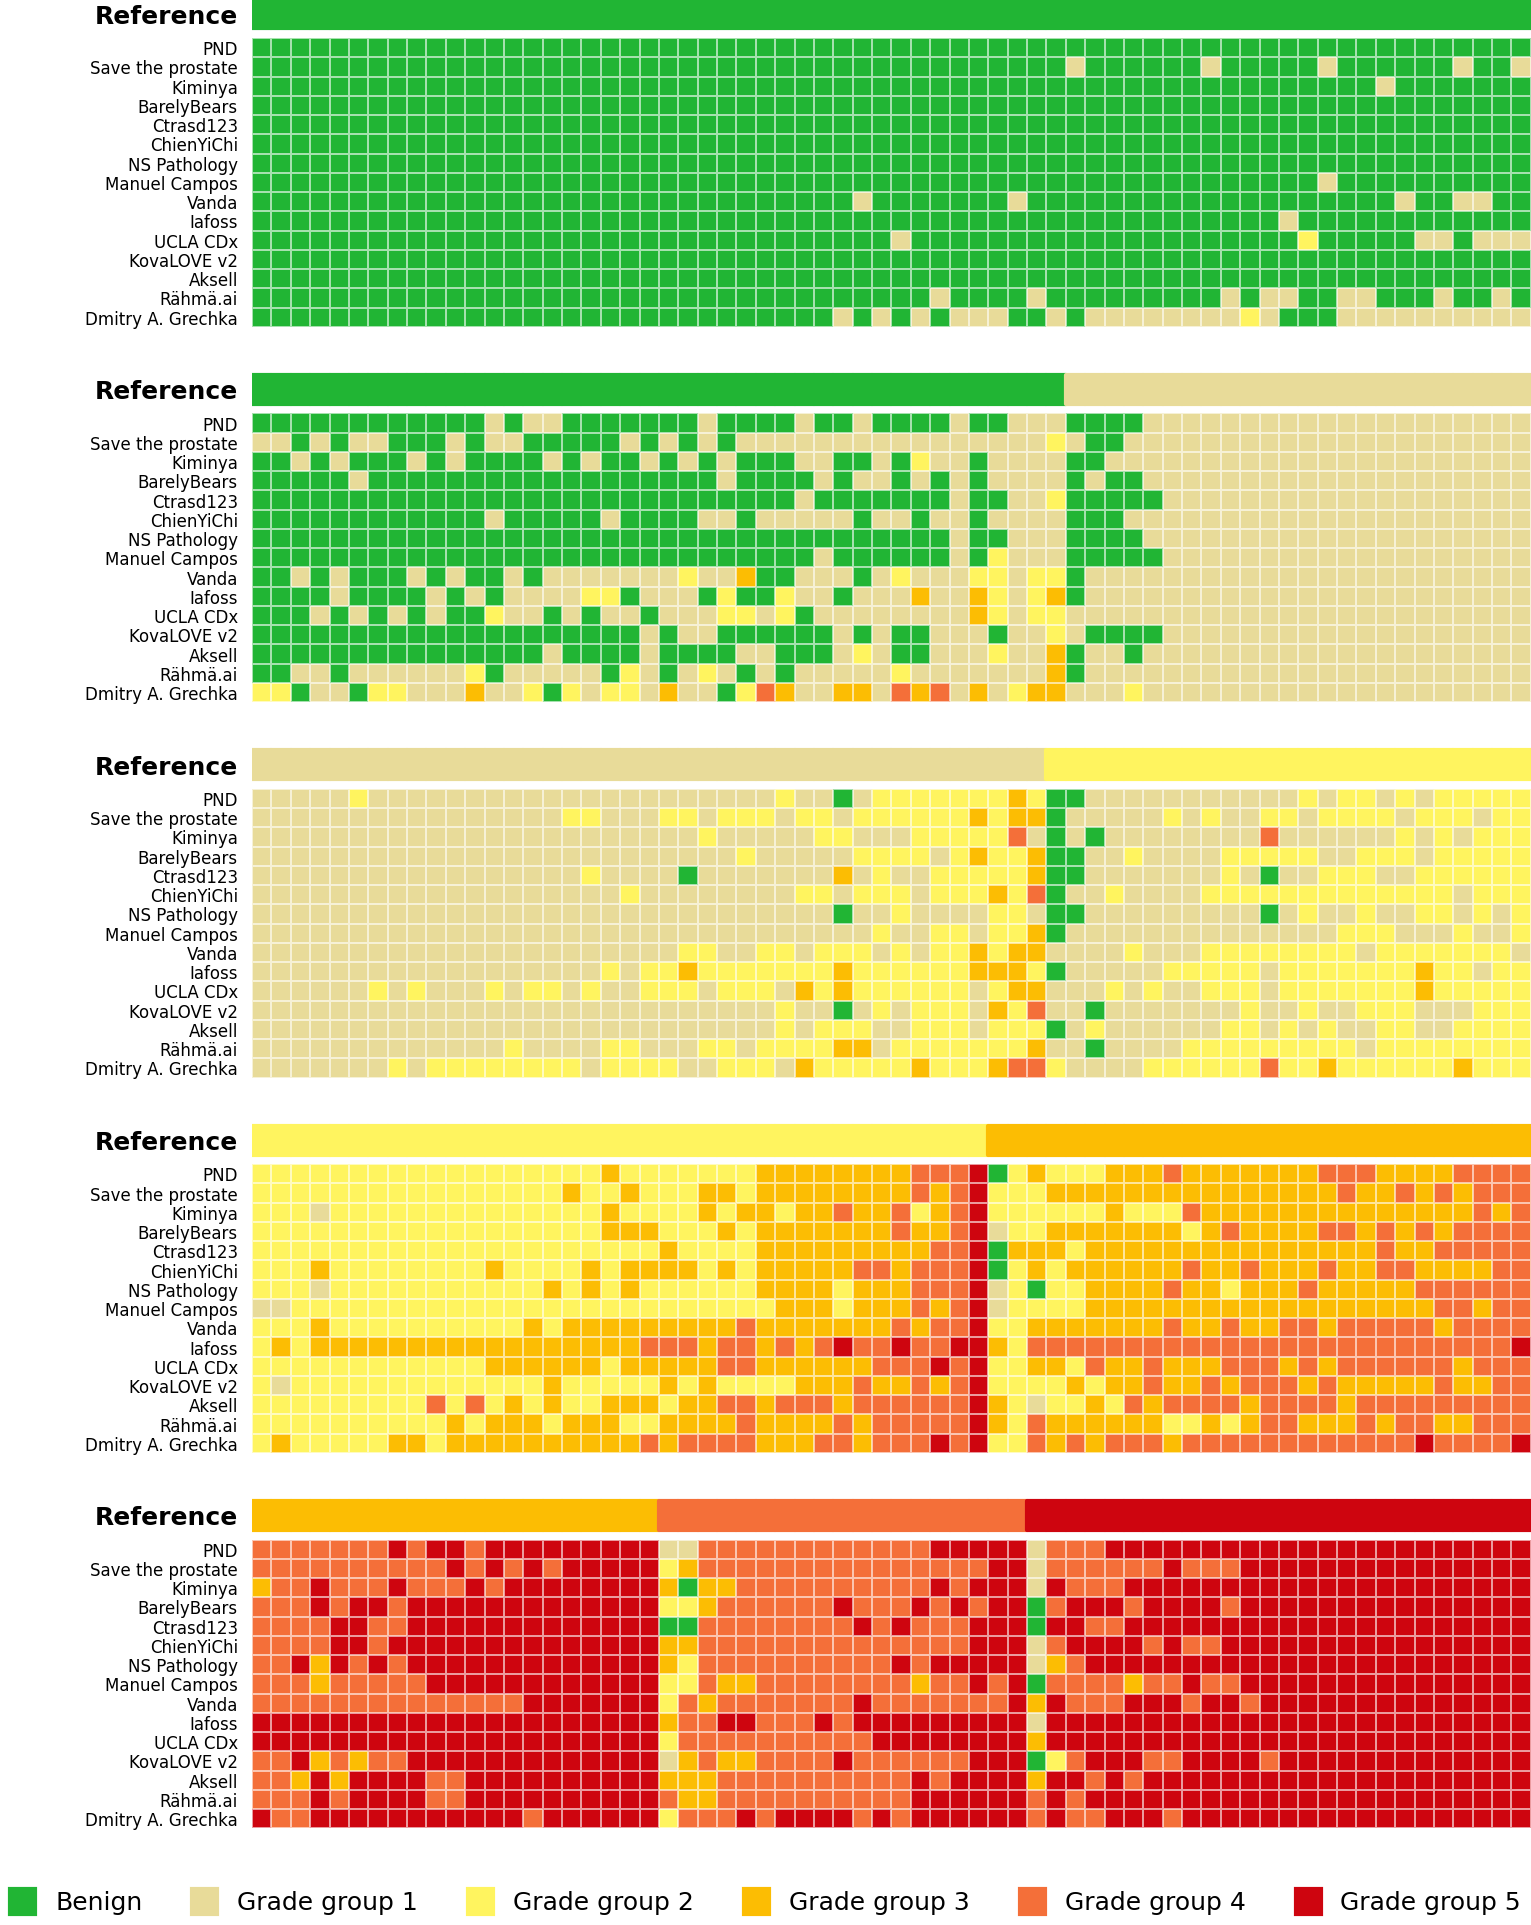
The algorithms were independently evaluated on the two external validation sets. The agreements with the reference standards were high with a quadratic-weighted kappa of 0.862 (95% CI, 0.840-0.884) and 0.868 (95% CI, 0.835-0.900) for the US and EU external validation sets, respectively. The main algorithm error mode was overdiagnosing of benign cases as ISUP grade group 1 cancer (Supplementary Figures 8 and 9). The classification performances of the individual algorithms are presented in Supplementary Figures 5, 6, 8 and 9.
The representative algorithm identified cases with tumor in the external validation sets with sensitivities of 98.6% (95% CI, 97.6-99.3) and 97.7% (95% CI, 96.2-99.2). In comparison to the internal validation set, the algorithms misclassified more benign cases as malignant resulting in specificities of 75.2% (95% CI, 66.8-80.0) and 84.3% (95% CI, 70.5-87.9) for the representative algorithm.
Classification performance compared to pathologists
To compare algorithms’ performances to general pathologists, we obtained reviews from two panels of pathologists on subsets of the internal and US external validation sets. For the Dutch part of the internal validation set, 13 pathologists from 8 countries (7 from Europe and 6 outside of Europe) reviewed 70 cases. For the US external validation set, 20 US board-certified pathologists reviewed 237 cases. For details on the pathologist review protocol, see Supplementary Methods Pathologist comparison review protocol.
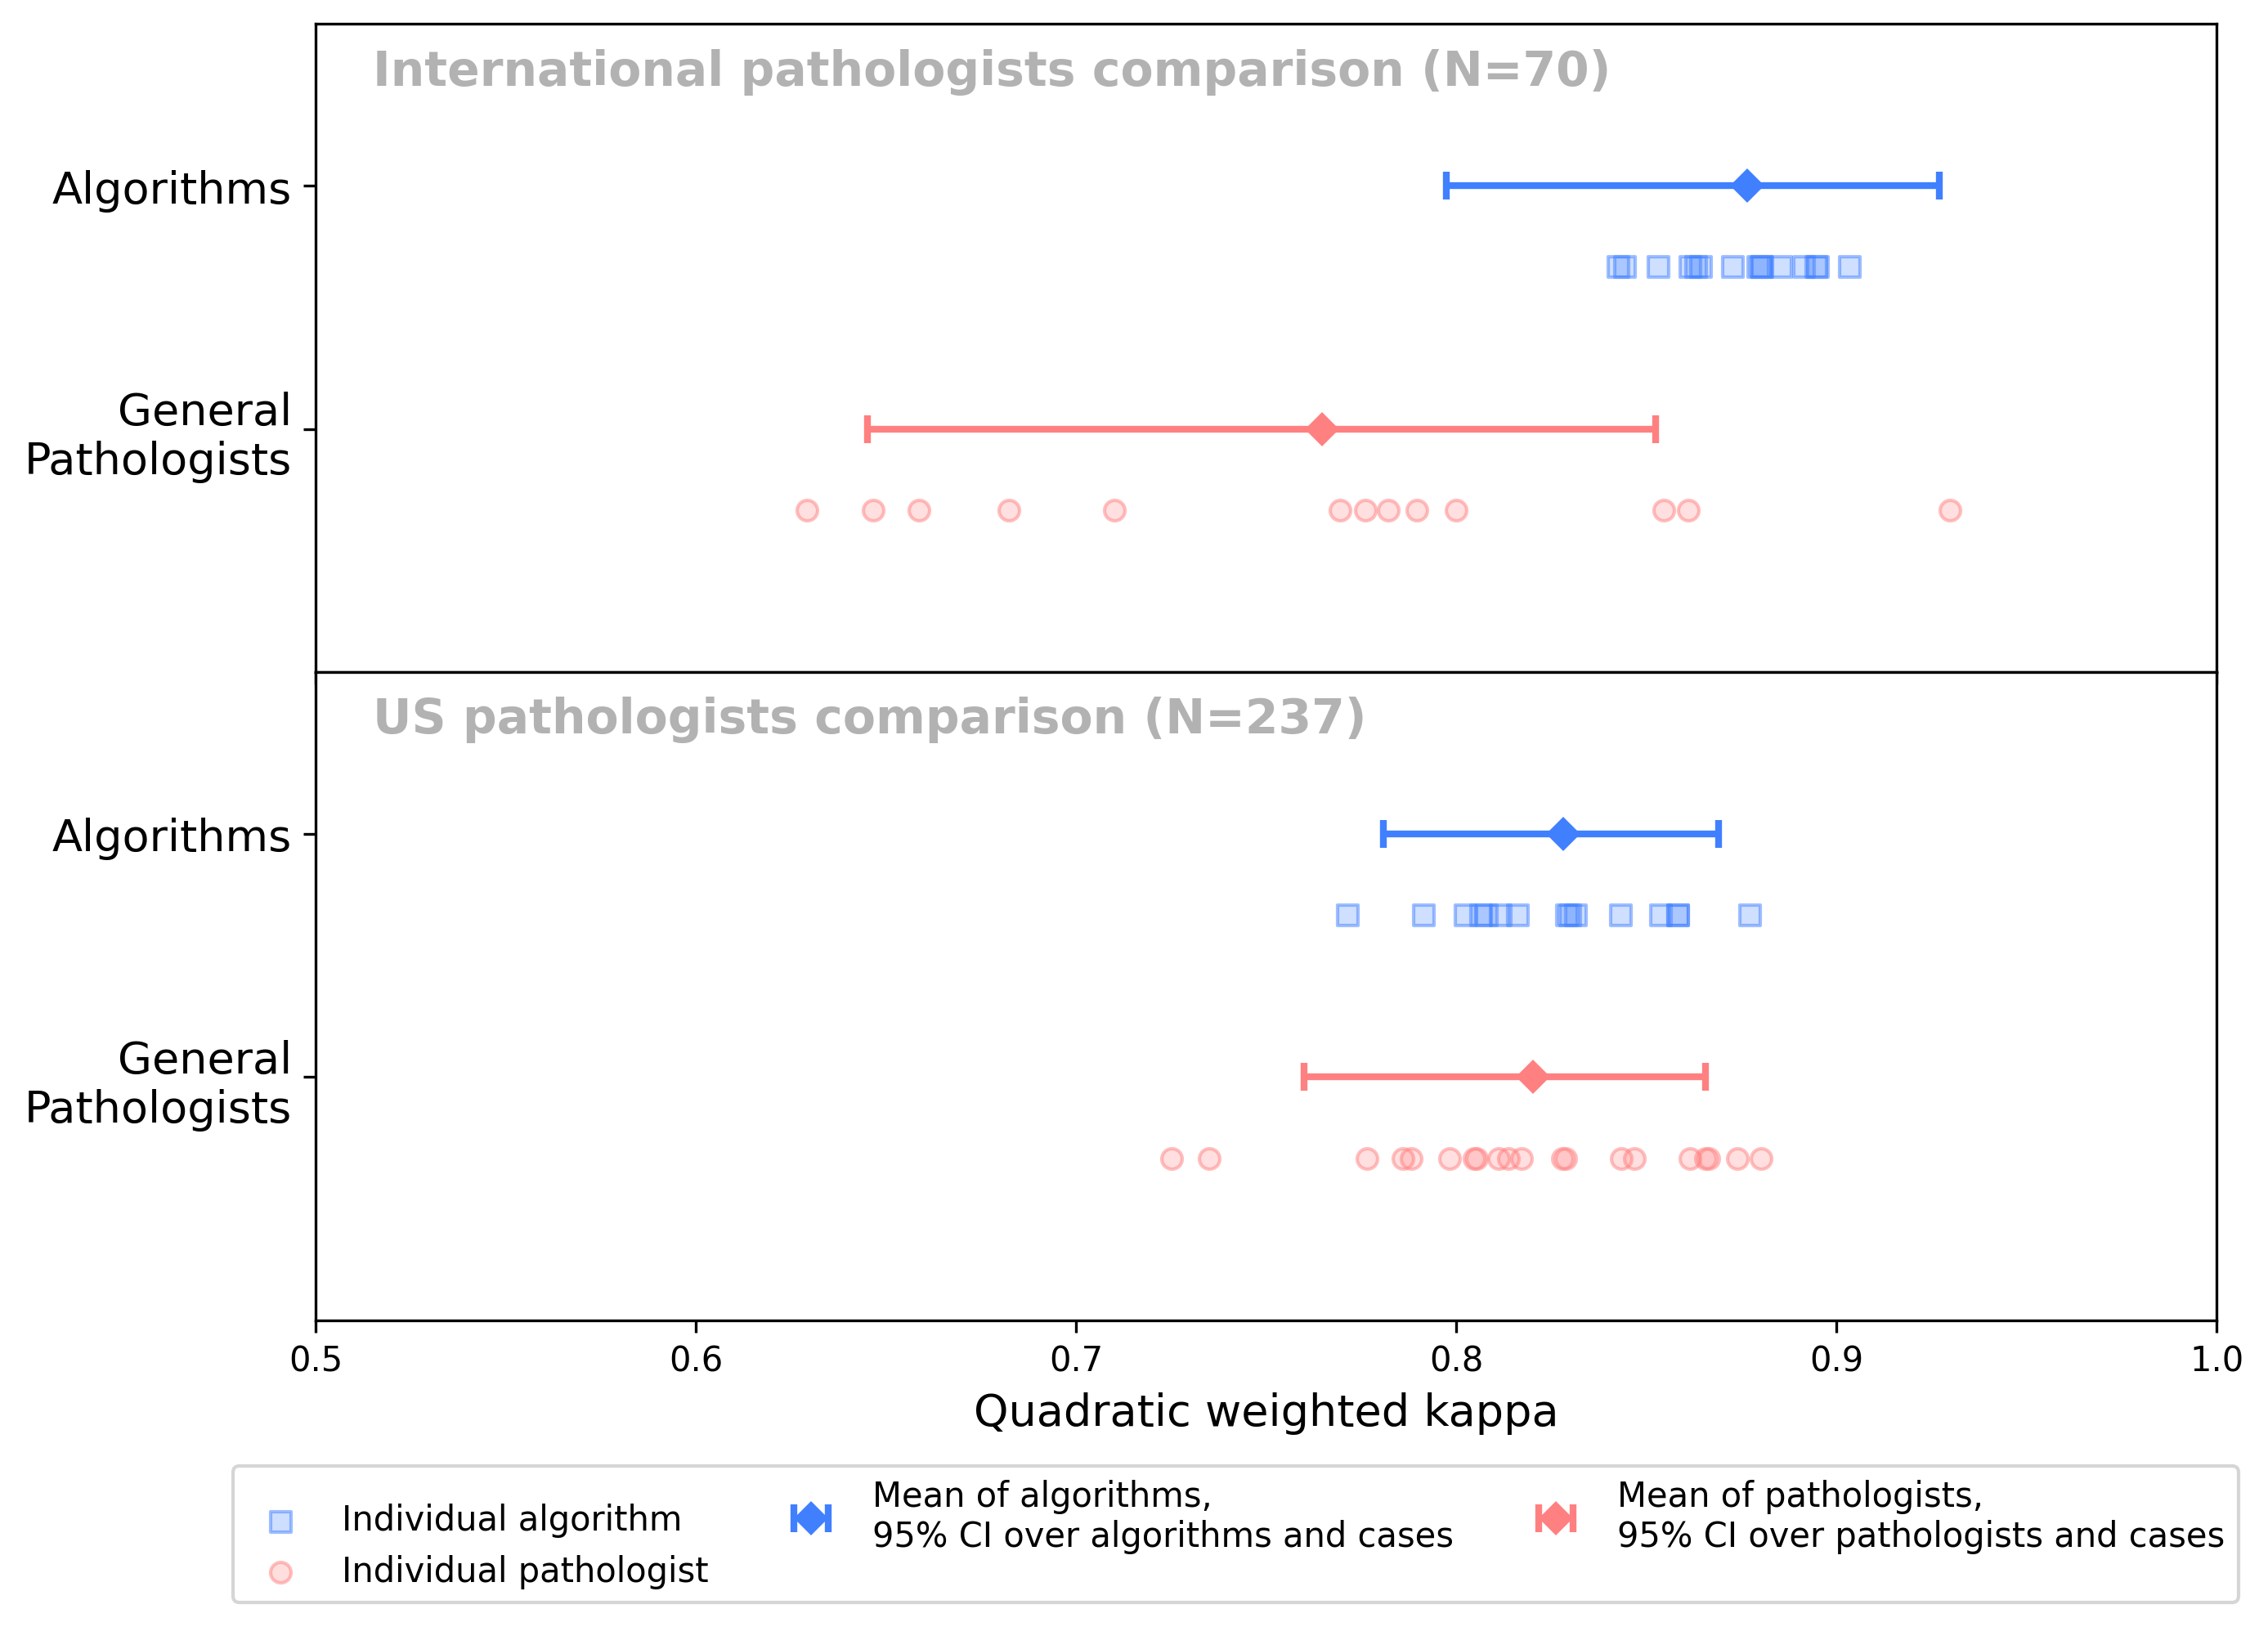
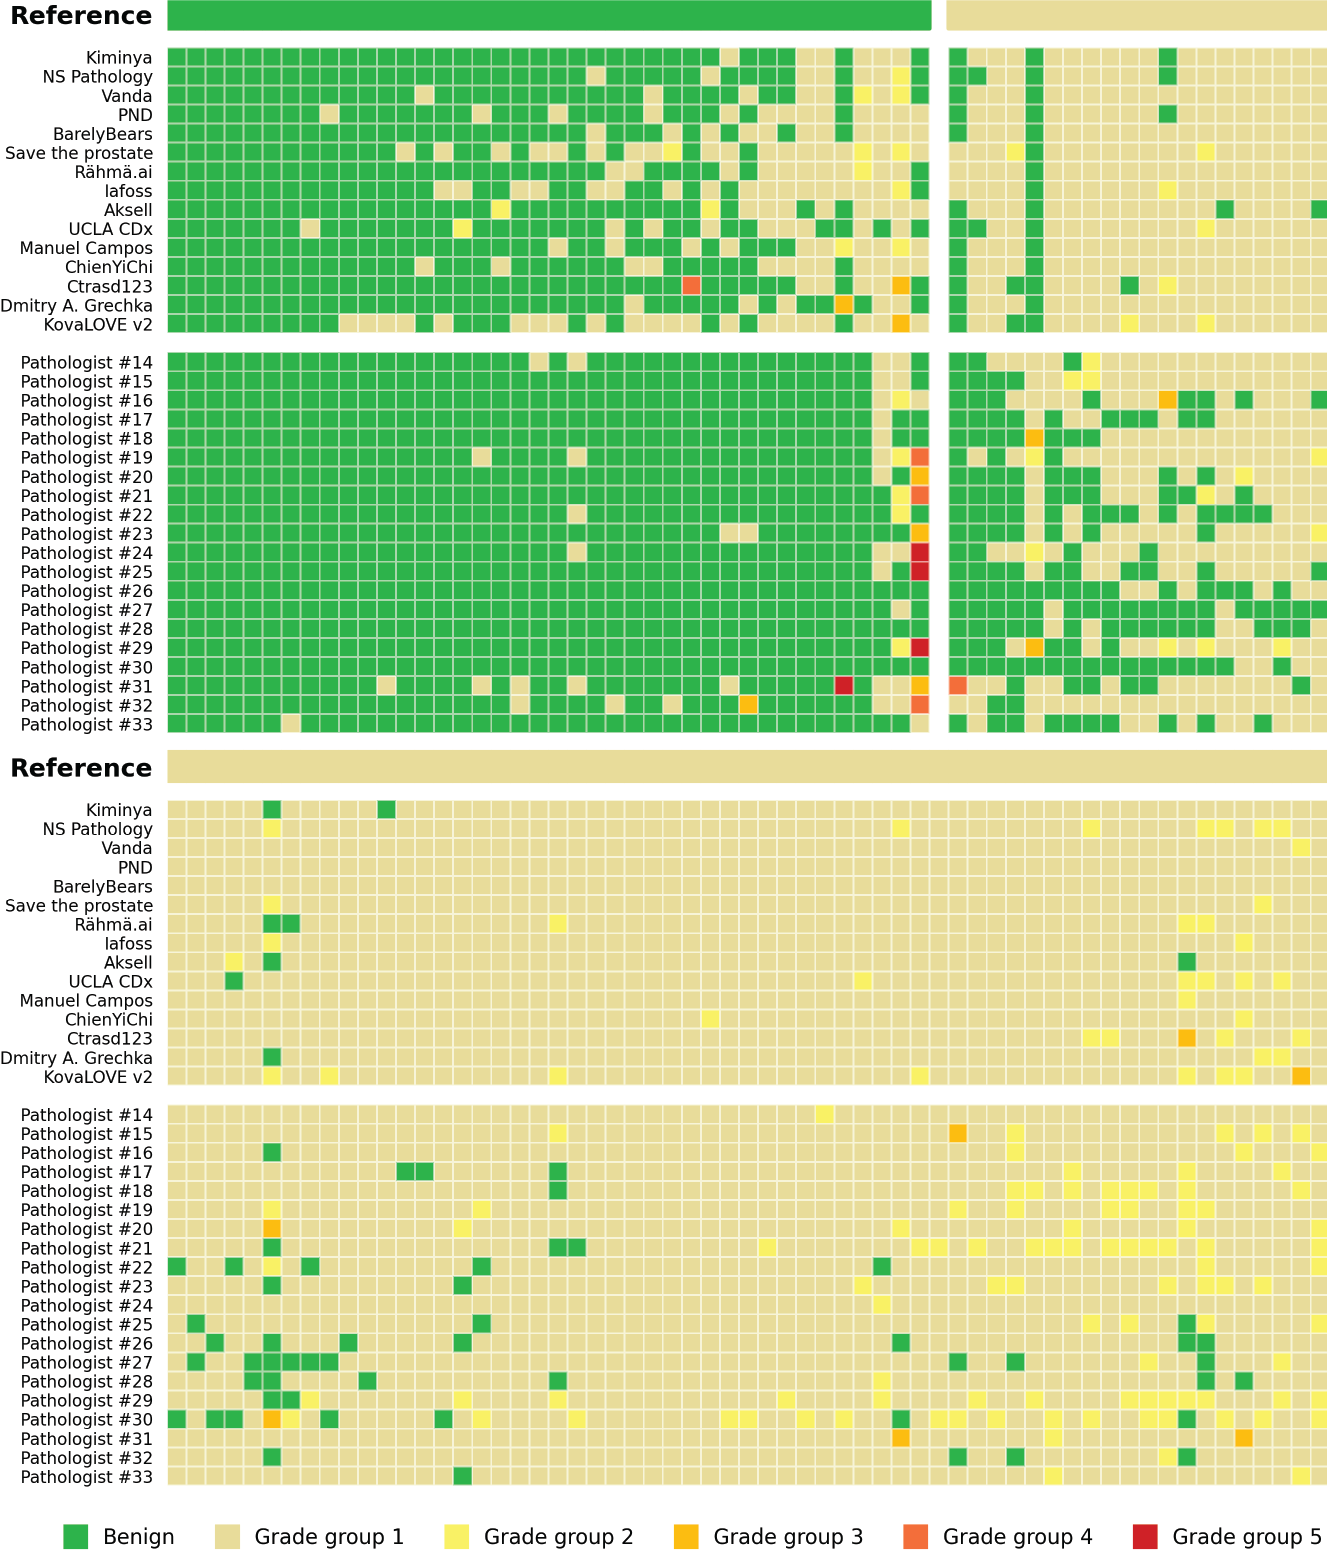
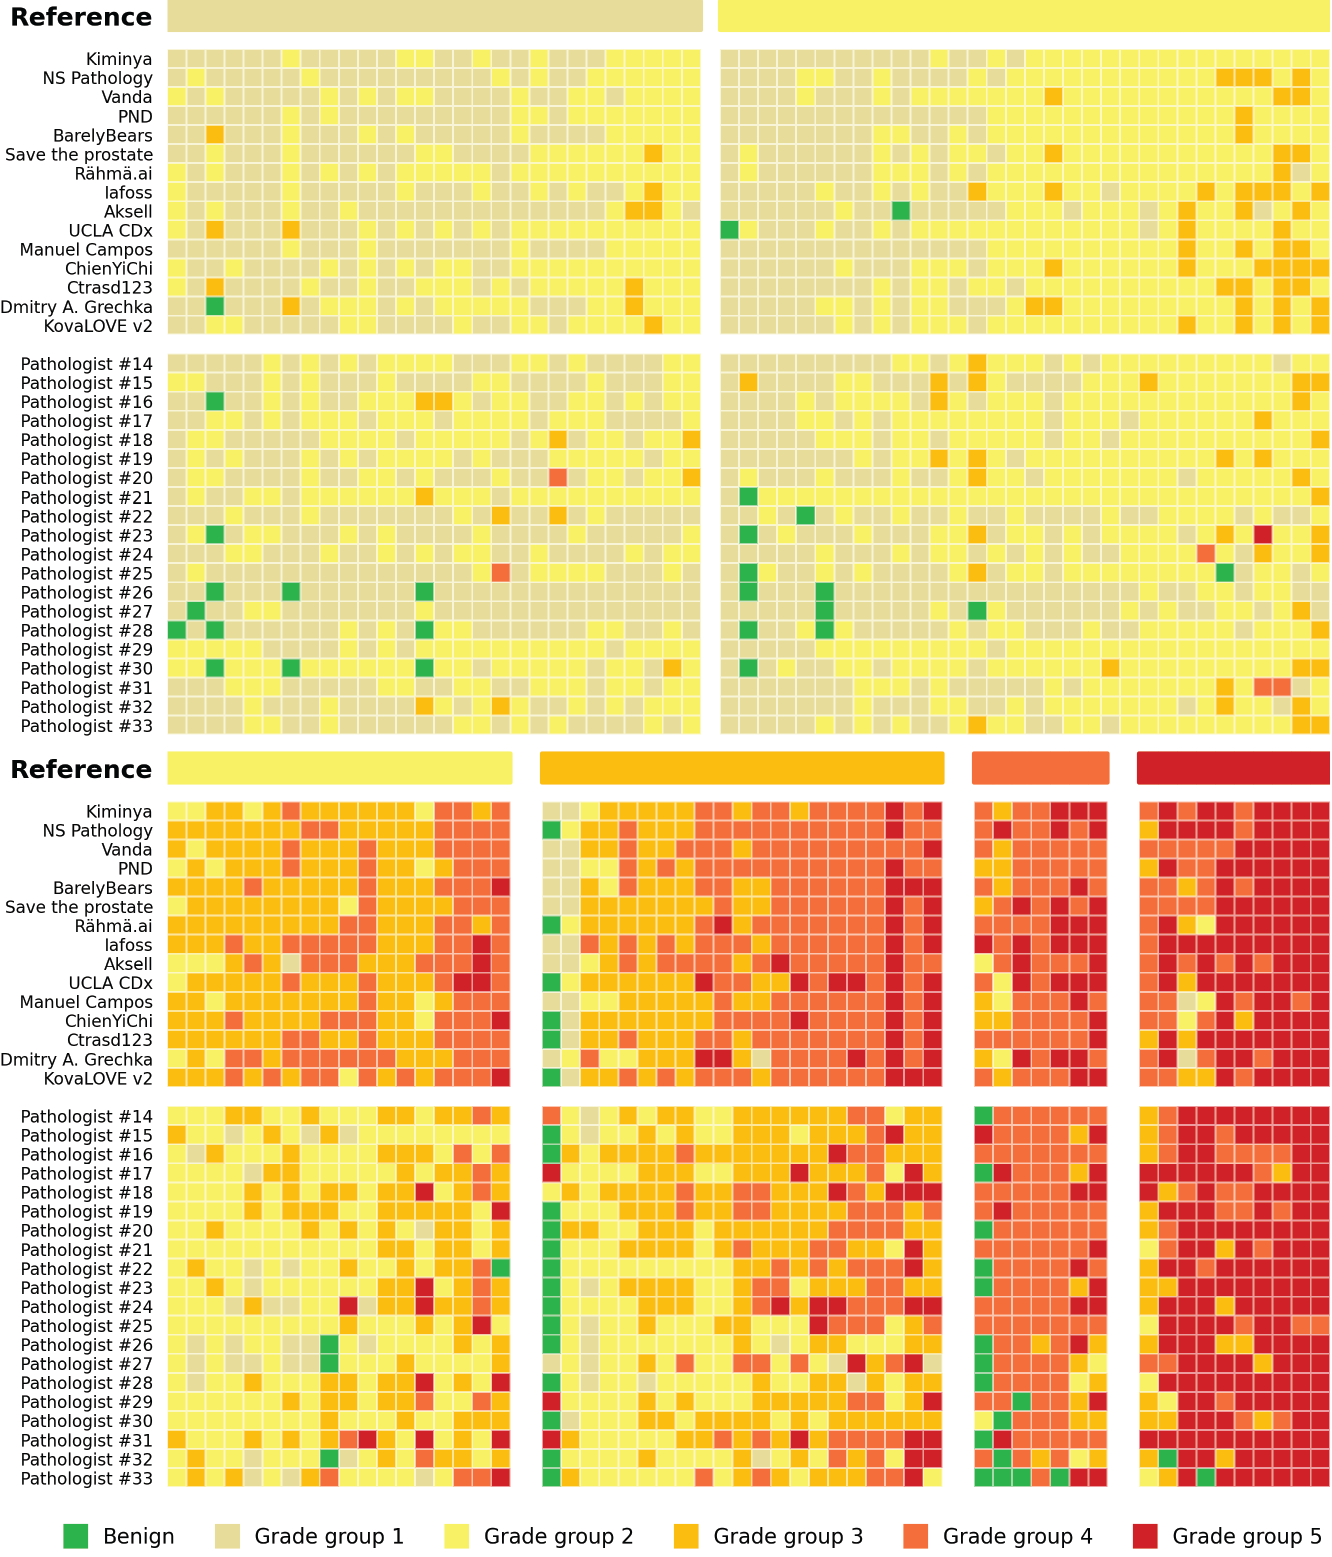
The algorithms scored significantly (p < 0.001) higher in agreement with the uropathologists (0.876, 95% CI, 0.797-0.927, Figure 4.4b) than the international general pathologists did (0.765, 95% CI, 0.645-0.852). The representative algorithm had higher sensitivity for tumor (98.2%, 95% CI, 97.4-100.0) than the representative pathologist (96.5%, 9% CI, 95.4-100.0) and higher specificity (100.0%, 95% CI, 90.6-100.0, versus, 92.3%, 95% CI, 77.8-97.8). On average, the algorithms missed 1.0% of cancers, whereas the pathologists missed 1.8%. Differences in grade assignments between the algorithms and pathologists are visualized in Figure 4.6.
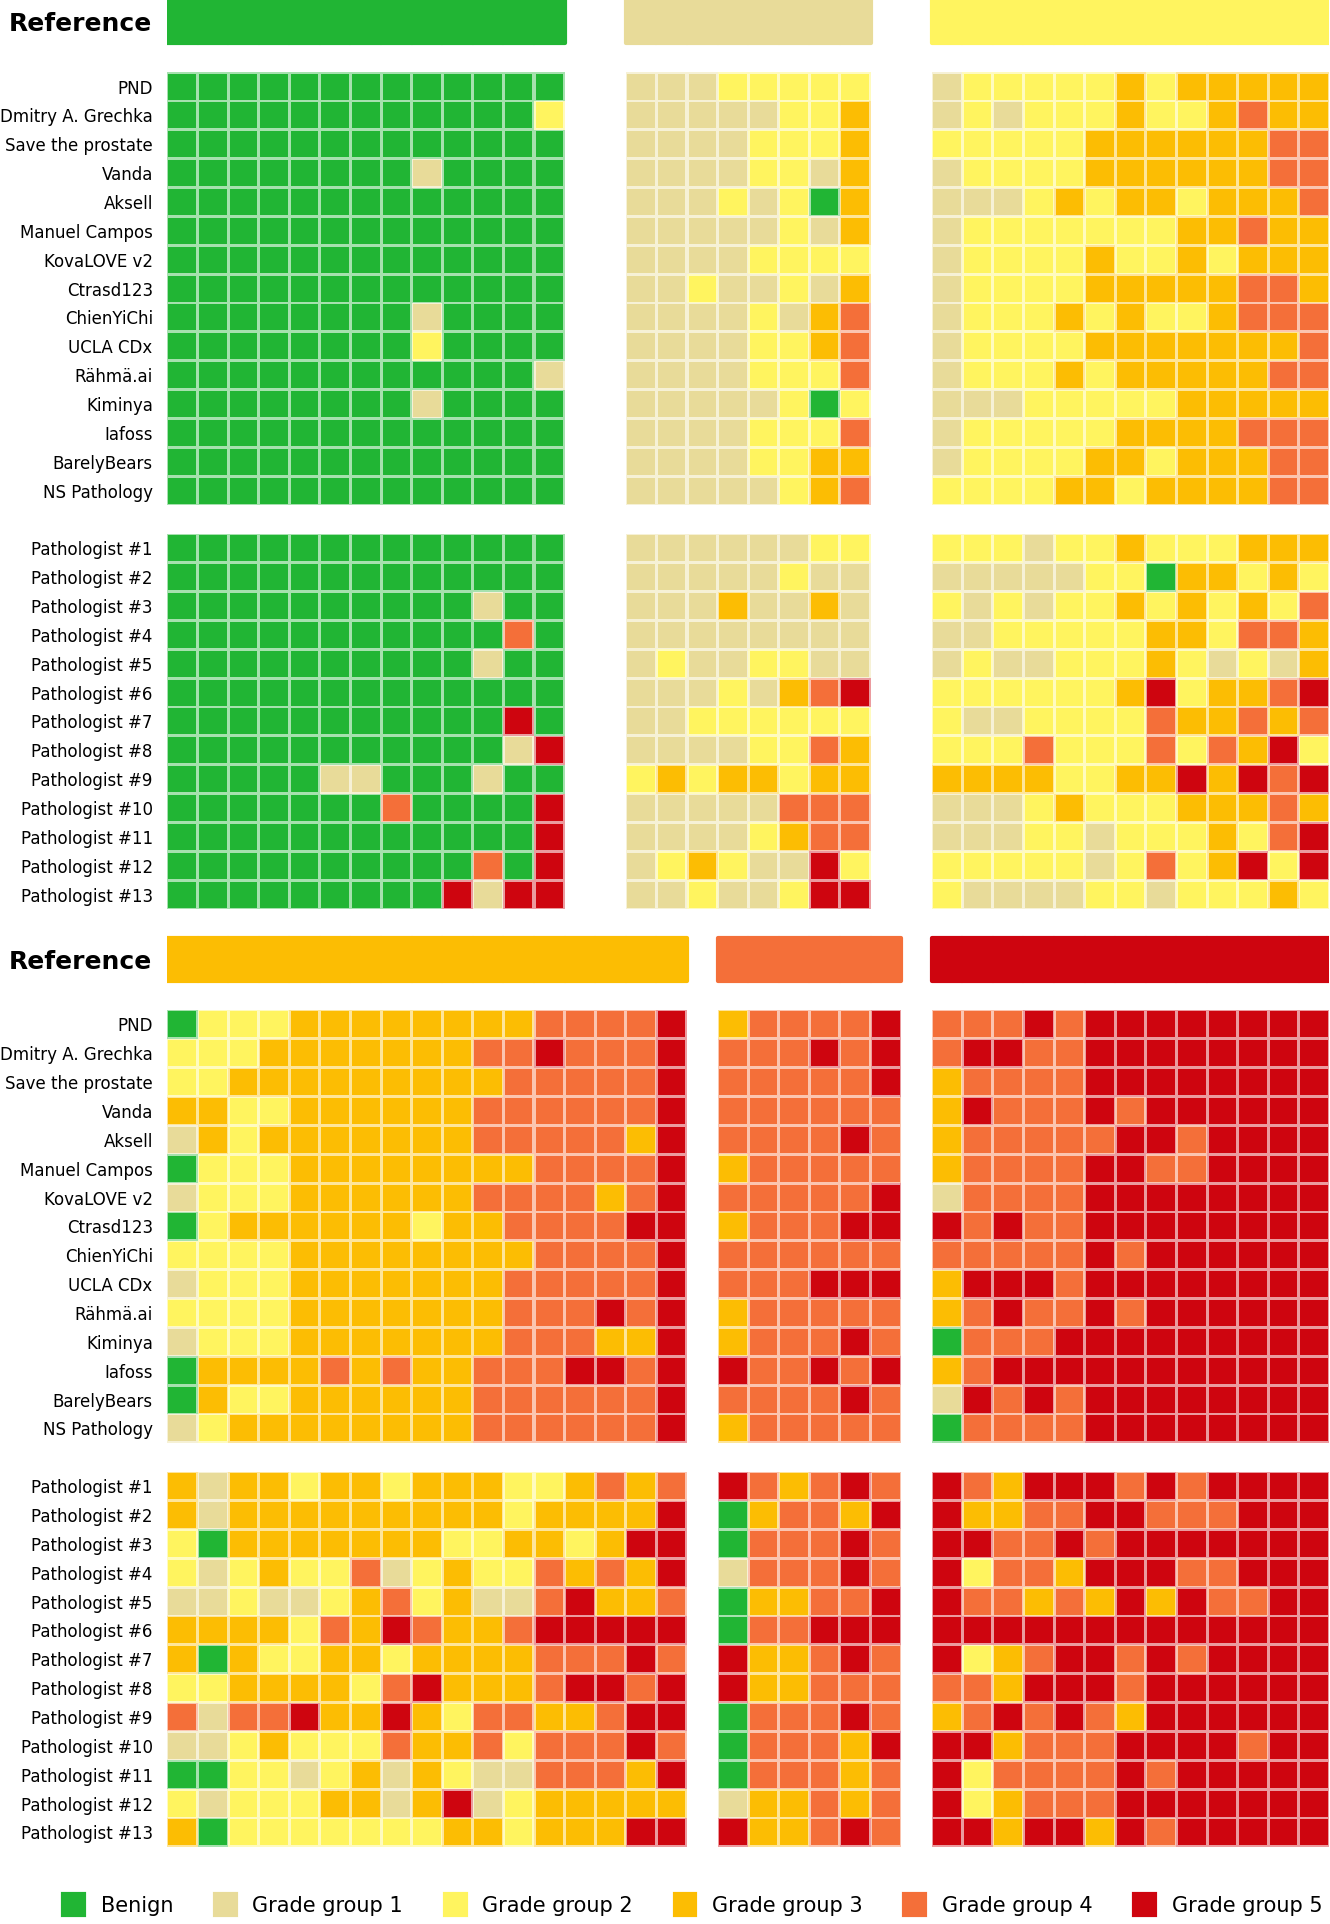
On the subset of the US external validation set with pathologist reviews, the algorithms exhibited a similar level of agreement with the uropathologists as the US general pathologists did (0.828, 95% CI, 0.781-0.869 vs. 0.820, 95% CI, 0.760-0.865; p = 0.53). The representative algorithm had higher sensitivity for tumor (96.4%, 95% CI, 96.6-99.5) than the representative pathologist (91.9%, 95% CI, 89.3-95.5) but lower specificity (75.0%, 95% CI, 61.2-82.7 versus 95.0%, 95% CI, 87.4-98.1). On average, the algorithms missed 1.9% of cancers, whereas the pathologists missed 7.3%. Differences in grade assignments between the algorithms and pathologists are visualized in Figures 4.7 and 4.8.
Discussion
AI has shown promise for diagnosis and grading of prostate cancer, but these results have been restricted to siloed studies with limited proof for generalization across diverse multinational cohorts, representing one of the central barriers to implementation of AI algorithms in clinical practice. The objective of this study was to overcome these critical issues. First, we aimed to facilitate community-driven development of AI algorithms for cancer detection and grading on prostate biopsies. Second, we sought to transcend isolated assessment of the diagnostic performance of individual AI solutions by focusing on reproducibility and fully blinded validation of a diverse group of algorithms on intercontinental and multinational cohorts.
The resulting PANDA challenge was the largest competition in pathology organized to date, both in terms of the number of participants and size of the datasets, and the first study to analyze a variety of AI algorithms for computational pathology at this scale.24 The datasets included variability in biopsy sampling procedure, specimen preparation process and whole slide scanning equipment, and had different sets of pathologists contributing to the reference standard. Our main finding was that AI algorithms obtained from a competition setup could successfully detect and grade tumors, reaching pathologist-level concordance with expert reference standards. Subsets of the internal and external validation datasets were also reviewed by groups of international and US pathologists. The algorithms had a concordance with the expert uropathologists that was similar to or higher than that of these groups of pathologists.
In the external validation sets, the main algorithm error mode was overdiagnosing of benign cases as ISUP grade group 1. This is likely due to the data distribution shift between training data and external validation data25 in combination with the study design of independent validation, where the teams did not have any access to the validation sets, potentially leading to suboptimal selection of operating thresholds based only on the tuning set. We observed this in the US external validation set (Figure 4.5), where the algorithms appear to be shifted toward higher sensitivity but lower specificity compared to the general pathologists. A potential solution to address the natural data distribution shift is to calibrate the models’ predictions using sampled data from the target sites.
In the US external validation set, tumor identification was confirmed by immunohistochemistry, supporting the finding that the algorithms missed fewer cancers than the pathologists. This higher sensitivity shows promise for reducing pathologist workload by automated identification and exclusion of the majority of benign biopsies from review. Analysis of an ensemble constructed from the algorithms suggests that combining existing algorithms could improve specificity (Supplementary Table 3).
Further analysis of the grade assignments by the algorithms and general pathologists showed that the algorithms tended to assign higher grades than the pathologists (Figures 4.6, 4.7 and 4.8). For example, in the US external validation set, algorithms overgraded a significant portion of ISUP grade group 3 cases as grade group 4. The general pathologists, in contrast, tended to under-grade cases, most notably in the high-grade cases. These differences suggest that general pathologists supported by AI could reach higher agreements with uropathologists, potentially alleviating some of the rater disagreement associated with Gleason grading.1012
We aimed to lower the entry barrier to medical AI development by providing access to a large, curated dataset, typically only attainable through large research consortia, and by organizing this competition to facilitate joint development with experience sharing among the teams. The results show that the publication of such datasets can lead to rapid development of high performing AI algorithms. Dissemination and fast iteration of new ideas resulted in the first team achieving pathologist-level performance in the first 10 days of the challenge (Figure 4.2a). These results show the important role data plays in the development of medical AI algorithms, given the short lead-time of top-performing solutions by various teams. At the same time, often raised criticisms of medical AI challenges are the lack of detailed reporting, and limited interpretation and reproducibility of results.19 Typically algorithms are only evaluated on internal competition data and by participants themselves, which introduces a risk of overfitting and reduced likelihood of reproducibility. We addressed these limitations in our challenge design by using pre-registration, blinded evaluation, full reproduction of algorithm results, independent validation of algorithms on external data and comparison with pathologists.
This study has limitations. First, algorithm validation focused on the assessment of individual biopsies whereas in clinical practice pathologists will examine multiple biopsies per patient. Second, this study focused on grading acinar adenocarcinoma of the prostate, and algorithm responses to other variants and subtypes of cancer, precancerous lesions, or non-prostatic tissue were not specifically assessed. Third, all the data were collected retrospectively across the institutions and the general pathologist reviews were conducted in a nonclinical setting, without additional clinical information available at the time of review. Fourth, despite the international nature of our evaluation (both in terms of pathologists’ practice and data sources), the countries involved were predominantly white, and demographic characteristics were not available in this study. Further investigation is required to validate the use of AI algorithms in more diverse settings.26 Lastly, this study did not evaluate the algorithm grading’s association directly with radical prostatectomy or clinical outcomes.
We found that a group of AI Gleason grading algorithms developed during a global competition generalized well to intercontinental and multinational cohorts with pathologist-level performance. On all external validation sets, the algorithms achieved high agreement with uropathologists and high sensitivity for malignant biopsies. The performance exhibited by this group of algorithms adds evidence of the maturity of AI for this task and warrants evaluation of AI for prostate cancer diagnosis and grading in prospective clinical trials. To stimulate further advancement of the field, the full development set of 10,616 biopsies is made publicly available.27
Methods
Study design
The study design of the PANDA challenge was pre-registered.20 We retrospectively obtained, and de-identified digitized prostate biopsies with associated diagnosis from pathology reports from Radboud University Medical Center, Nijmegen, The Netherlands and Karolinska Institutet, Stockholm, Sweden (Supplementary Figures 1 and 2 and Methods Dataset inclusion and exclusion criteria, Reference standard protocol and Pathologist comparison review protocol). At the beginning of the competition, participating teams gained access to this EU development set of 10,616 biopsies from 2,113 patients for training of the AI algorithms (Table 4.1, Supplementary Methods Available training data during the competition). During the course of the competition, the teams could upload their algorithms to the Kaggle platform (Supplementary Methods Kaggle competition platform) and receive performance estimates on a tuning set of 393 biopsies. Processing time was limited to 6 hours and the maximum GPU memory available was 16GB.
By the competition closing date, each team picked two algorithms of their choice for their final submission, and the higher-scoring of the two determined the team’s final ranking. The final evaluation was performed on an internal validation dataset of 545 biopsies, collected from the same sites as the development and tuning sets and fully blinded to the participating teams. Moreover, to obtain an independent internal validation set, all samples from a given patient were used for either development or validation.
After the competition on the Kaggle platform ended, teams were invited to send in a proposal to join the validation phase of the study as members of the PANDA consortium. Joining the validation phase was fully voluntary and not a prerequisite for partaking in the competition. As a result, 15 teams were selected for further evaluation on two external validation datasets consisting of 741 and 330 biopsies, also fully blinded to the participating teams (Supplementary Methods Methods to select the 15 teams for external validation and Summary of participating teams’ methods). The first external validation set was obtained from two independent medical laboratories and a tertiary teaching hospital in the United States. The second external validation set was obtained from the Karolinska University Hospital, Stockholm, Sweden. All datasets consisted of both benign biopsies and biopsies with various ISUP grade groups. For details on the inclusion and exclusion criteria, see Supplementary Methods Dataset inclusion and exclusion criteria and Supplementary Figures 1, 2, 3 and 4.
Whole slide images (WSI) of the biopsies were obtained using four different scanner models from three vendors: 3DHISTECH, Budapest, Hungary; Hamamatsu Photonics, Hamamatsu, Japan; and Leica Biosystems, Wetzlar, Germany (Supplementary Tables 1 and 2).
The study was approved by the institutional review board of Radboud University Medical Center (IRB 2016–2275), Stockholm regional ethics committee (permits 2012/572-31/1, 2012/438-31/3, and 2018/845-32), and Advarra (Columbia, MD; Pro00038251). Informed consent was waived due to the usage of de-identified prostate specimens in a retrospective setting.
Reproducing algorithms and application to validation sets
All teams selected for the PANDA consortium were asked to provide all data and code necessary for reproducing the exact version of their algorithm that resulted in the final competition submission. For each algorithm, we collected the main Jupyter notebook or python script for running the inference, the specific Kaggle Docker28 image (https://github.com/Kaggle/docker-python) used by the team during the competition, and any necessary associated files, including model weights and auxiliary code.
We replicated the computational setup of the competition platform and ran the algorithms on two different computational systems: Google Cloud and Puhti compute cluster (CSC - IT Center for Science, Espoo, Finland). On the Google Cloud platform, all algorithms were run using the original Docker images. On Puhti, the Docker images were automatically converted for use with Singularity.29 The algorithms and scripts provided by the teams were not modified except for minor adjustments required for successful run-time installation of dependencies on our computational systems. On Puhti, the algorithms had access to 8 CPU cores, 32 GB of memory, one Tesla V100 32GB GPU (Nvidia, Santa Clara, CA, USA) and 500 GB of SSD storage. On the Google Cloud platform, the algorithms had access to 8 CPUs, 30 GB memory, one Tesla V100 32GB GPU and 10000 GB of HDD storage.
Before applying the algorithms on the external validation sets, we first validated that the Kaggle computational environment had been correctly replicated and the algorithms’ performance on our systems remained identical. To this end, we ran all algorithms on the tuning and internal validation sets on the two systems to reproduce the output generated during the competition on the Kaggle platform. By cross-checking the new results with the competition leaderboard we additionally assured that the algorithms supplied by the teams were not altered after the competition or tuned to perform better on the external validation sets. The verification runs we performed on the Puhti cluster were used as the basis for all results reported on the internal validation set.
Some algorithms were non-deterministic, e.g., because of test time augmentations with non-frozen random seeds. We ran each of these algorithms five times, and averaged the computed metrics.
After verification, we ran all algorithms on the external validation sets. For the US external validation set, we used the Google Cloud platform. For the EU external validation set, we used the Puhti cluster. This process was done independently of the teams and no prior information about the external datasets was supplied to the teams. The ISUP grade group predictions of the algorithms on the cases were saved and used as input for the analysis.
Statistical analysis
We defined the main metric as the agreement on ISUP grade group with the reference standard of each particular validation set, measured using quadratic Cohen’s kappa. To compare the performance of the algorithms with the general pathologists, we performed a two-sided permutation test per pathologist panel. The average agreement was calculated as the mean of the kappas across the algorithms and the pathologists, respectively. The test statistic was defined as the difference between the average algorithm agreement and the average pathologist agreement.
We calculated sensitivity and specificity on benign versus cancer-containing biopsies for all algorithms and individual general pathologists, based on the reference standard set by the uropathologists. Additionally, we determined the average number of biopsies with missed cancer per group. To further understand how a representative pathologist and algorithm performed, we selected the pathologist and the algorithm with the median balanced accuracy (the average of sensitivity and specificity), and reported the associated sensitivity and specificity of these two representatives. We reported the 95% confidence interval of the algorithms’ and pathologists’ performance metrics using bootstrapping, with both the algorithm or pathologist and case as the resampling unit.
Analysis was performed using Python (version 3.8) in combination with the following software packages: scipy (1.5.4), pandas (1.1.4), mlxtend (0.18.0), numpy (1.19.4), scikit-learn (0.23.2), matplotlib (3.3.2), jupyterlab (2.2.9) and notebook (6.1.5).
Data availability
The full development set, from here on named the PANDA Challenge dataset, of 10,616 digitized de-identified H&E stained prostate biopsies (383GB) will be made publicly available for further research. The data can be used under a Creative Commons BY-SA-NC 4.0 license. The most up-to-date information regarding the dataset can be found on the challenge website at https://panda.grand-challenge.org/.
Code availability
Code that was used to generate the results of the various algorithms, and example code on how to load the images in the PANDA dataset is available at https://github.com/DIAGNijmegen/panda-challenge. Algorithms were built using open source deep learning frameworks, including Pytorch (https://pytorch.org/) and TensorFlow (https://www.tensorflow.org/). The Docker image that all the algorithms were based on is available online at https://github.com/Kaggle/docker-python.
Acknowledgements
Supported by the Dutch Cancer Society (KWF, grant number KUN 2015-7970), Netherlands Organization for Scientific Research (NWO) (project number 016.186.152), Google LLC, Verily Life Sciences, Swedish Research Council, Swedish Cancer Society, Swedish eScience Research Center, EIT Health, Karolinska Institutet, Åke Wiberg Foundation, Prostatacancerförbundet, Academy of Finland, Cancer Foundation Finland, ERAPerMed.
We thank the MICCAI board challenge working group, the MICCAI 2020 satellite event team and the MICCAI challenge reviewers for their support in the challenge workshop and review of the challenge design. We thank Kaggle for hosting the competition, providing compute resources and the competition prizes. We thank CSC - IT Center for Science, Finland, for providing computational resources. We thank Ellery Wulczyn, Annisah Um’rani, Yun Liu, and Dale Webster for their feedback on the manuscript and guidance of the project. We thank our collaborators at NMCSD, particularly Niels Olson, for internal re-use of de-identified data which contributed to the US external validation set.
The PANDA Consortium
The PANDA Challenge consortium consists of algorithm developers who participated in the PANDA challenge and pathologists who contributed to the reference standards and/or pathologist comparisons. The PANDA Challenge consortium was specifically formed for this study.
Pathologist participating in the international pathologists comparison
- Américo Brilhante, MD, Salomão Zoppi Diagnostics/DASA, São Paulo, Brazil
- Aslı Çakır, MD, Pathology Department, School of Medicine, Istanbul Medipol University, Istanbul, Turkey
- Xavier Farré, MD PhD, Department of Health, Public Health Agency of Catalonia, Lleida, Catalonia, Spain
- Katerina Geronatsiou, MD, Centre de Pathologie 68, Hopital Diaconat Mulhouse, Groupe Hospitalier de la Region Mulhouse Sud Alsace (GHR- MSA), Mulhouse, France
- Vincent Molinié, MD PhD, Aix en Provence Hospital, Aix en Provence Hospital, Aix en Provence, France
- Guilherme Pereira, MD, Histo Patologia Cirúrgica e Citologia, João Pessoa-PB, Brazil
- Paromita Roy, MD, Department of Pathology, Tata Medical Center, Kolkata, India
- Günter Saile, MD, Abteilung für Histopathologie und Zytologie, Iabor team w ag, Goldach SG, Switzerland
- Paulo G.O. Salles, MD PhD MBA, Belo Horizonte, Instituto Mário Penna, Brazil
- Ewout Schaafsma, MD PhD, Department of Pathology, Radboud Institute for Health Sciences, Radboud University Medical Center, Nijmegen, The Netherlands
- Joëlle Tschui, MD, Medics Pathologie, Bern, Switzerland
- Jorge Billoch-Lima, MD FCAP, HRP Labs, San Juan, Puerto Rico, USA
- Emílio M. Pereira, MD, Department of Pathology, Oncoclínicas group, São Paulo, São Paulo, Brazil
Uropathologists who set the reference standard of the US external validation set
- Mahul B. Amin, MD, Department of Pathology and Laboratory Medicine, University of Tennessee Health Science Center, Memphis, Tennessee, USA
- Andrew J. Evans, MD PhD, Laboratory Medicine, Mackenzie Health, Toronto, Ontario, Canada
- Theodorus van der Kwast, MD PhD, Department of Pathology, Laboratory Medicine and Pathology, University Health Network and University of Toronto, Toronto, Ontario, Canada
- Ming Zhou, MD PhD, Department of Pathology and Laboratory Medicine, Tufts Medical Center, Boston, Massachusetts, USA
- Robert Allan, MD, Pathology and Laboratory Medicine Service, North Florida/South Georgia Veterans Health System, Gainesville, Florida, USA
- Peter A. Humphrey, MD PhD, Department of Pathology, Yale School of Medicine, New Haven, Connecticut, USA
Algorithm developers
Overview of teams that participated in the PANDA challenge and who were accepted to join the PANDA consortium.
Dmitry A. Grechka
- Dmitry Grechka, No affiliation, Russia
BarelyBears
- Hiroshi Yoshihara, Department of Health Informatics, Kyoto University, Kyoto, Japan
- Taiki Yamaguchi, Preferred Networks Inc., Tokyo, Japan
- Kosaku Ono, Nowcast Inc., Tokyo, Japan
- Tao Shen, School of Biological Science and Medical Engineering, Southeast University, Nanjing, Jiangsu, China
Save The Prostate
- Rui Guo, University of Michigan, Ann Arbor, Michigan, USA
- Chia-Lun Hsieh, No. 7, Taipei City, Taiwan
- Igor Zubarev, No affiliation, Tula, Russia
- Habib S.T. Bukhar, Janelia Research Campus, Ashburn, Virginia, USA
PND
- Yusuke Fujimoto, Rist Inc., Tokyo, Japan
- Kentaro Yoshioka, Wireless System Lab., Toshiba Corp., Kawasaki, Japan
rähmä.ai
- Joni Juvonen, Silo AI, Turku, Finland
- Mikko Tukiainen, Silo AI, Turku, Finland
- Antti Karlsson, University of Turku, Turku, Finland
KovaLOVE v2
- Vassili Kovalev, PhD, Biomedical Image Analysis Department, The United Institute of Informatics Problems, Minsk, Belarus
- Dmitry Voynov, Biomedical Image Analysis Department, The United Institute of Informatics Problems, Minsk, Belarus
- Valery Malyshev, Biomedical Image Analysis Department, The United Institute of Informatics Problems, Minsk, Belarus
- Elizabeth Lapo, Biomedical Image Analysis Department, The United Institute of Informatics Problems, Minsk, Belarus
vanda
- Kyungdoc Kim, PhD, VUNO Inc., Seoul, Republic of Korea
- Byeonguk Bae, VUNO Inc., Seoul, Republic of Korea
- Yeong Won Kim, VUNO Inc., Seoul, Republic of Korea
- Hong-Seok Lee, VUNO Inc., Seoul, Republic of Korea
- Jeonghyuk Park, VUNO Inc., Seoul, Republic of Korea
ctrasd123
- Tianrui Chai, School of Computer Science and Engineering, Beihang University, Beijing, China
- Nina Weng, DTU Compute, Technical University of Denmark, Lyngby, Denmark
NS Pathology
- Noriaki Ota, Systems Research & Development Center, Technology Bureau, NS Solutions Corp., Kanagawa, Japan
- Shinsuke Yamaoka, Systems Research & Development Center, Technology Bureau, NS Solutions Corp., Kanagawa, Japan
Kiminya
- Raphael Kiminya, No affiliation, Nairobi, Kenya
Iafoss
- Maxim V. Shugaev, PhD, Department of Materials Science and Engineering, University of Virginia, Charlottesville, Virginia, USA
Aksell
- Shujun He, Texas A&M University, Texas, USA
- Sejun Song, No affiliation, Republic of Korea
- Qing Sun, Texas A&M University, Texas, USA
ChienYiChi
- Jianyi Ji, CTAccel Ltd., ShenZhen, China
- Arnaud Roussel, Jumio Corp., Canada
- Kairong Zhou, ELEME Inc., China
Manuel Campos
- Manuel Campos, No affiliation, Madrid, Comunidad de Madrid, Spain
UCLA Computational Diagnostics Lab
- Wenyuan Li, Computational Diagnostics Lab, University of California, Los Angeles, Los Angeles, California, USA
- Jiayun Li, Computational Diagnostics Lab, University of California, Los Angeles, Los Angeles, California, USA
- William Speier, Computational Diagnostics Lab, University of California, Los Angeles, Los Angeles, California, USA
- Corey Arnold, Computational Diagnostics Lab, University of California, Los Angeles, Los Angeles, California, USA
Supplementary methods
Dataset inclusion and exclusion criteria
Development, tuning and internal validation set
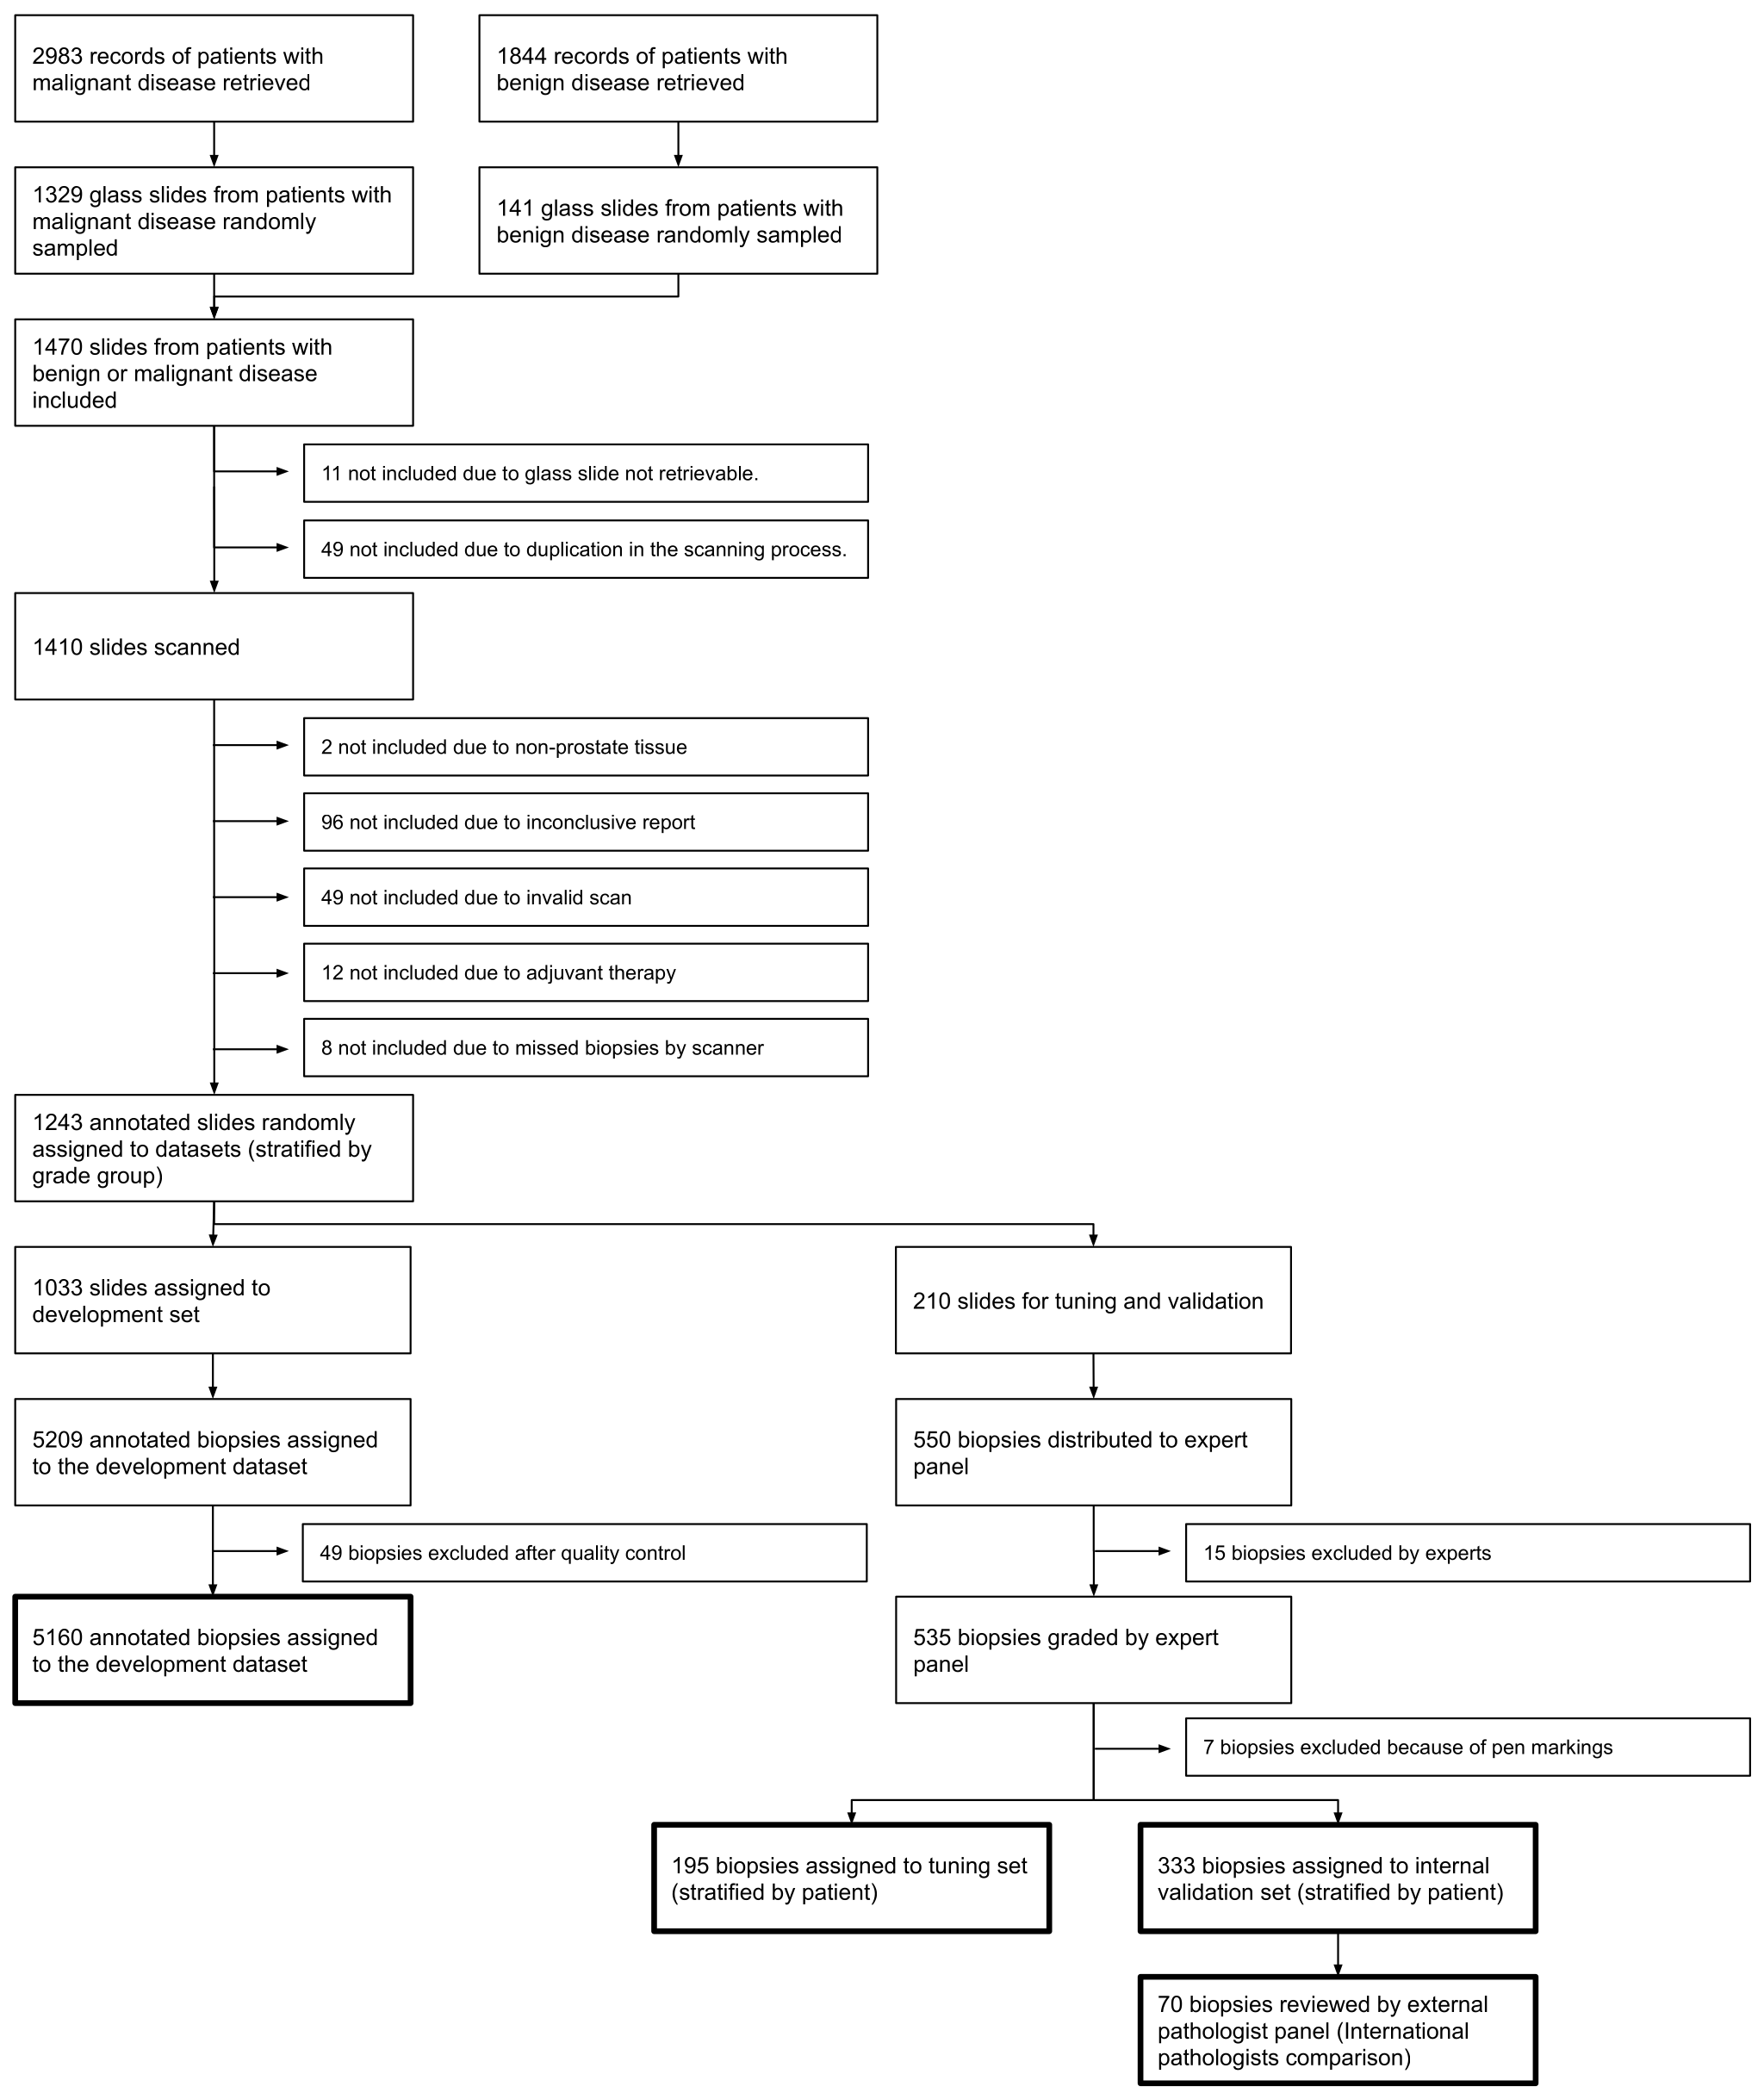
For the development, tuning and internal validation set to be used in the PANDA challenge, we collected data from two different centers, namely Radboud University Medical Center (The Netherlands) and Karolinska Institutet (Sweden). These datasets were originally collected as part of two independent studies on automated Gleason grading.1011 For the purpose of this challenge, the datasets were merged and further refined. We will briefly reiterate the data collection here; further details can be found in the respective papers.
For the Radboud data, we retrieved all pathology reports dated between Jan 1, 2012, and Dec 31, 2017, for patients who underwent a prostate biopsy owing to a suspicion of prostate cancer (Supplementary Figure 1).10 Patients were randomly sampled based on the highest reported Gleason score mentioned in each report. Additionally, a set of reports was sampled which only mentioned benign biopsies. For each patient, a single hematoxylin and eosin-stained glass slide was selected for scanning. The selected glass slides were scanned using a 3DHistech Pannoramic Flash II 250 (3DHistech, Hungary) scanner at a pixel resolution 0.24 µm. Slides were then randomly sampled to be included in the development, tuning and internal validation sets. Randomization was stratified by patient and highest Gleason pattern present in the biopsy.
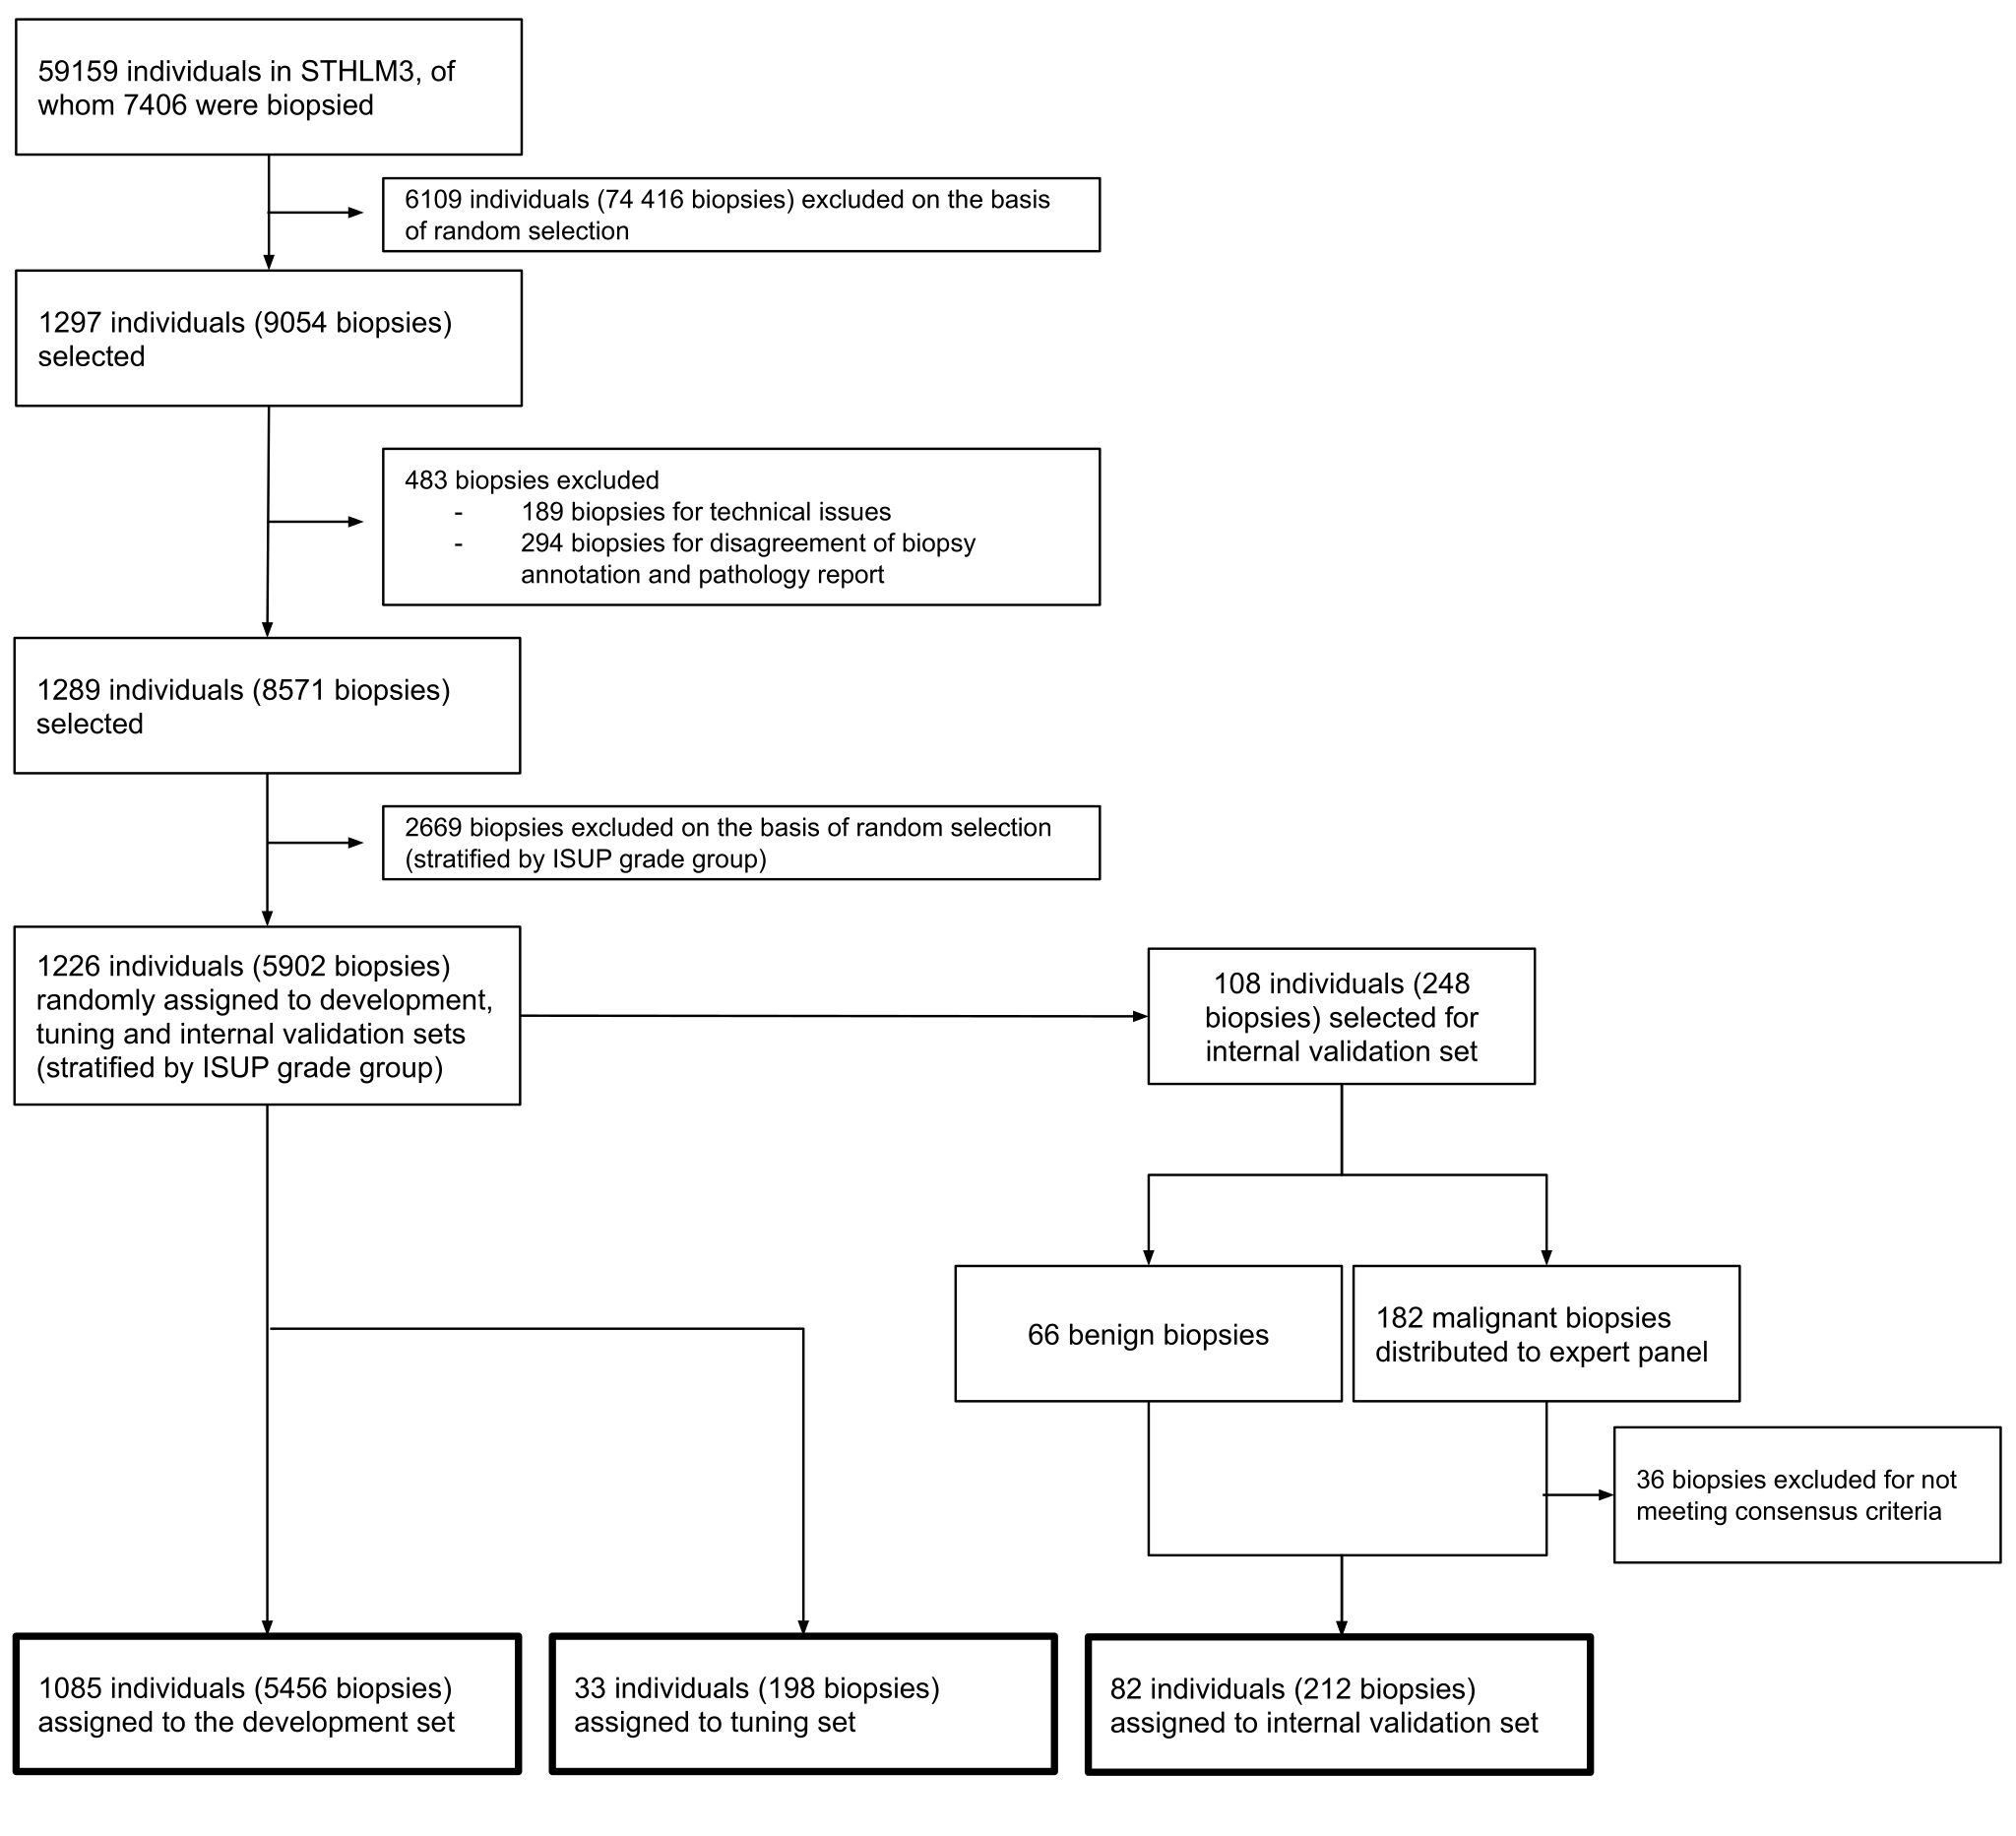
The data from Karolinska comes from the Stockholm-3 diagnostic trial that was conducted between May 28, 2012 and Dec 30, 2014 (Supplementary Figure 2, ISRCTN84445406).113031 It was a prostate cancer screening-by-invitation trial of men aged 50–69 years living in Stockholm, Sweden. The purpose of the trial was to compare prostate specific antigen (PSA) to the Stockholm-3 model (S3M) for predicting the presence of cancer, and the criterion for referral to biopsy was either PSA above 3 ng/ml or a S3M probability of 10% or higher. A single pathologist (L.E.) assessed all biopsy cores in the trial and marked out the regions of cancer next to the tissue on the glass slide with a marker pen. A random sample from the biopsies included in the trial was taken, stratified on patient and the reported Gleason score to avoid including too many of the prevalent benign and low grade diseases. The selected slides were digitized at 20X magnification using two scanners: Hamamatsu C9600-12 (Hamamatsu Photonics, Hamamatsu, Japan) and Aperio ScanScope AT2 (Leica Biosystems, Wetzlar, Germany). The pixel size at full-resolution was 0.45202 µm (Hamamatsu) or 0.5032 µm (Aperio). Slides were then randomly sampled to be included in the development, tuning and internal validation sets. Randomization was stratified by patient and ISUP grade group.
To reduce the overall size of the various sets, and to achieve comparable resolution between centers, the Radboud images were downsampled and exported at a pixel spacing of 0.48 µm; the Karolinska images were exported at the original pixel spacing of 0.45 µm or 0.50 µm depending on the scanner. The images were exported as resolution pyramids with three levels representing downsampling factors of 1, 4 and 16 relative to the full resolution. All images were converted to TIFF format with JPEG compression and a quality setting of 70.
US external validation set
The US external validation set consisted of retrospective cases from three different sources, and is described in detail in a prior study (Supplementary Figure 3).9 Briefly, cases were obtained from two medical laboratories and one tertiary teaching hospital. All tumor-containing cases available from the tertiary teaching hospital from 2005-2007 were included, and a fraction of the benign biopsies available were randomly sampled for inclusion. From the medical laboratories, all available ISUP grade group 4-5 cases were included in the study, and remaining benign and ISUP grade group 1-3 cases were randomly sampled for inclusion. One representative biopsy per case was included. Biopsies with non-gradable prostate cancer variants or quality issues preventing diagnosis were excluded from the dataset. Slides were digitized on an Aperio AT2 scanner (Leica Biosystems, Wetzlar, Germany) at a resolution of 0.25 µm/pixel (“40X magnification”). All images were converted to TIFF format with JPEG compression and a quality setting of 70.
EU external validation set
The EU external validation set comprised biopsy cores assessed by L.E. at the Karolinska University Hospital during 2018 (Supplementary Figure 4). The set included all positive biopsy cores from all men diagnosed with an ISUP grade group 2, 3, 4, or 5 cancer as well as from a random selection of men diagnosed with ISUP grade group 1 cancer during that time period. In addition, the set included all cores from a random selection of men with only benign biopsies. This resulted in 330 slides from 73 men, scanned with a Hamamatsu NanoZoomer S360 C13220-01 (Hamamatsu Photonics, Hamamatsu, Japan). The pixel size at full resolution was 0.4604 µm. All images were converted to TIFF with JPEG compression and a quality setting of 70.
Reference standard protocol
Development set - Radboud University Medical Center
For the cases in the development set from Radboud University Medical Center, the reference standard was determined based on the original pathology report. After scanning of the slides, trained non-experts assessed all slides and coarsely outlined each biopsy, assigning each with a Gleason score or the label ‘negative’ on the basis of the pathology report. If the pathologist report was inconclusive or lacked a description of individual biopsies, cases were flagged for a second review. If no match could be made in the second read, cases were excluded. To generate detailed label masks at gland-level, the biopsies were processed by a trained deep learning system that segmented the glands and assigned individual Gleason patterns to each gland.10
Development set - Karolinska Institutet
The cases from the Karolinska Institutet that were part of the development set were reviewed by a single uropathologist (L.E.). The review of the cases was performed on the original glass slides through a microscope. The uropathologist reported both the Gleason score and the ISUP grade group for each biopsy. Additionally, the uropathologist placed pen marks on the glass slide alongside tumor tissue. Approximate label masks indicating benign and malignant tissue pixels were automatically generated based on the pen marks.11
Internal validation set and tuning set - Radboud University Medical Center
The reference standard for the Radboud University Medical Center cases that were part of the tuning and validation sets was determined in three rounds. In the first round, three uropathologists (C.H.v.d.K., R.V., H.v.B.) individually graded the cases digitally using the ISUP 2014 guidelines. For a number of cases, the majority vote was taken: cases with an agreement on ISUP grade group but a difference in Gleason pattern order, e.g., 5 + 4 versus 4 + 5; cases with an equal grade group but a disagreement on Gleason score; and cases for which two pathologists agreed while the third had a maximum deviation of one grade group. Cases with a disagreement on malignancy were always flagged for a second read in round two. In the second round, each biopsy without consensus was regraded by the uropathologist whose score differed from the other two. Additional to the pathologist’s initial examination, the Gleason scores of the other pathologists were appended anonymously. Biopsies without consensus after round two were discussed in a consensus meeting.
Internal validation set and tuning set - Karolinska Institutet
The cases from the Karolinska Institutet that were part of the tuning set were reviewed by a single uropathologist (L.E.), similarly to the development set. The cases that were part of the internal validation set were initially reviewed by a single uropathologist (L.E.) on the original glass slides through a microscope. Cases initially indicated as benign were not re-reviewed. Cases indicated as malignant were divided between two other uropathologists (B.D. and H.S.), each reviewing 100 cases. In case of agreement between the first and the second review, the consensus ISUP grade group was assigned to the case. In case of disagreement, a third uropathologist (T.T.) reviewed the case. For cases that were indicated as malignant by all pathologists, the final ISUP grade group was assigned according to 2/3 consensus. If all three reviews were in disagreement, the case was excluded from the internal validation set. Any cases indicated as benign in the second or third review were excluded from the internal validation set. The second and third reviews were performed digitally using Cytomine,32 with all pathologists blinded to the other reviews.
US external validation set
The US external validation set was reviewed by six uropathologists (M.B.A., A.J.E., T.K., M.Z., R.A., and P.A.H.) from 6 institutions with 18 to 34 years of clinical experience after residency (mean, 25 years). Reviews were first performed by 2 of the 6 uropathologists. A third uropathologist reviewed the specimens when there were discordances between the first two uropathologists. For cases without a majority opinion after 3 independent reviews, the median classification was used.
To limit the potential ambiguity of identifying Gleason patterns due to tissue processing procedure, such as tangential cuts of the specimen, two additional adjacent sections (levels) of the specimens were also available during review. Furthermore, one additional section per specimen was stained with the PIN-4 immunohistochemistry cocktail (P504S plus p63 plus high molecular weight cytokeratin) to assist the identification of cancer tissue. The three levels and the one PIN-4 stained slide were made available to the pathologists for establishing the reference standard.
EU external validation set
The cases from the Karolinska University Hospital that were part of the EU external validation set were reviewed by a single uropathologist (L.E.). The review of the cases was performed on the original glass slides through a microscope. The uropathologist reported both the Gleason score and the ISUP grade group for each biopsy.
Pathologist comparison review protocol
International pathologists comparison
As part of a previous study,10 100 biopsies were selected to be presented to a group of pathologists in an observer experiment. Benign cases were selected manually, controlling for a broad range of tissue patterns, including inflammation and (partial) atrophy. Cases containing cancer were sampled at random, stratified for ISUP grade group. Of these 100 cases, 70 were included in the internal validation set and used for the comparison to the panel of international pathologists.
The biopsies were made available through an online viewer, PMA.view (Pathomation, Berchem, Belgium), and distributed to an external cohort of pathologists. Cohort members were invited to participate in this study at the United States and Canadian Academy of Pathology 2019 annual meeting in Washington, DC, USA (March 16–21, 2019). Interested pathologists were subsequently asked to invite colleagues in their network who had experience in Gleason grading. All pathologists who graded all biopsies were included. All cohort members had experience with Gleason grading, but to a varying degree. No time restriction was given, although we asked that they complete the grading within six weeks. In the original study, both pathologists and pathology residents were included. For the current study, only reads from pathologists were included. In total, the cohort consisted of 13 pathologists from eight countries (seven from Europe, six from outside of Europe).
US pathologists comparison
A subset of the US external validation set was reviewed by 20 US board-certified general pathologists. The pathologists reviewed the biopsies based on the 2014 ISUP grading guidelines.33 Clinical information was not provided during grading and the pathologists were asked to review and grade biopsies as if they were reviewing a clinical slide in practice, without time constraints.
Available training data during the competition
For algorithm development, teams could only use the competition dataset and publicly available datasets. For public datasets, usage was only allowed if teams disclosed this beforehand on the competition’s public forum. By disclosing the use of external data, teams had no unfair advantage due to extra data availability. The use of private data, not available to other teams, was not allowed during the competition.
As part of the development set, we shared additional data besides the raw digitized biopsies to speed up development of the algorithms. As the reference standard, a comma-separated file (CSV) was supplied that mapped each biopsy ID to a Gleason score and ISUP grade group. Additionally, each training slide had an associated label mask that contained additional information about the tissue. The label masks were generated differently per institution and contained different types of labels.
For the slides originating from Radboud, each label mask outlined the tissue within the slide. Each pixel was labeled as either background, stroma/other tissue, benign epithelium, or one of the Gleason patterns 3, 4, or 5. The label masks were generated semi-automatically using a trained deep neural network and contained label noise. Additional details on how these masks were generated can be found in the respective paper.10
For the slides originating from Karolinska Institutet, the label masks were generated based on the annotations of the pathologist who graded the development set. Each label mask outlined the tissue areas within the slide. Additionally, for slides containing cancer, areas that contained malignant tissue were coarsely outlined in the mask. Further details on how these masks were generated can be found in the respective paper.11
Kaggle competition platform
The PANDA challenge was hosted on Kaggle, one of the largest data science competition platforms. A competition typically runs for three months, during which participants or a team of participants can try to achieve the highest score in the competition’s task. A Kaggle competition consists of two leaderboards: a public leaderboard visible during the competition and a hidden private leaderboard. The public leaderboard gives teams an indication of how well their algorithm is performing during the competition. The blinded private leaderboard is used to determine the final competition ranking. Each algorithm submission is evaluated on both datasets, but only the score on the public leaderboard is shown to the teams. Because the private leaderboard is not shown, teams cannot directly tune their algorithm to score high on this leaderboard. For the PANDA challenge, the tuning set was used for the public leaderboard and the internal validation set for the private leaderboard. For the competition’s final ranking, the teams could select two of the submissions entered during the competition, of which the highest scoring one was used for the ranking.
Competitions on Kaggle often have prize money for the top-performing teams to incentivize participants to sign up and reward them for the work done. For the PANDA challenge, the top three teams on the private leaderboard were awarded monetary prizes by Kaggle.
Entering the competition on Kaggle was free and open to everyone, after agreeing to the competition rules. After signup, participants had full access to the development set, which could be downloaded directly from the Kaggle website.
As part of the platform, every user had access to 30 free GPU hours per week for algorithm development. The development set was readily available when developing on the Kaggle platform, and no download was required. Additionally, participants were free to develop their algorithm offline on their hardware.
Participants were asked to submit a working version of their algorithm in the form of a Jupyter Notebook or a Python script to enter the competition. This notebook or script could have associated data that contained the learned parameters of the algorithm and any other required data sources. The submitted algorithm was required to be fully self-contained, which makes it possible to reproduce the results at a later stage. The algorithm had to be developed to process all cases supplied in a specific directory automatically. After submission, the platform populated this directory with the tuning set and internal validation set cases. This processing was fully blinded to the submitter of the algorithm. Processing time was limited to 6 hours when the algorithm used a GPU. Maximum GPU memory available was 16GB. To prevent cheating, algorithms did not have internet access during this evaluation, nor could they download or upload additional data. The number of allowed submissions was limited per team and participant to a maximum of three per day. The only information disclosed to the submitter was the public leaderboard score (and not the performance on individual cases).
Through a dedicated discussion forum, participants could discuss their algorithms and problems across teams. Participants often used the discussion forum to disseminate new ideas or share additional resources. Additionally, teams could share public versions of algorithms or code snippets for others to iterate on further. One of these public notebooks was created by the organizers to kick-start the competition and showcase the dataset.
Methods to select the 15 teams for external validation
One month before the competition deadline, a post was placed on the competition’s discussion forum to invite teams to join the PANDA consortium. Sign-up was open to all teams that submitted a working algorithm during the competition. The deadline for signing up was July 31st, 2020, eight days after the end of the competition. When signing up, teams were asked to report: team name, team members, the data requirements of their method, whether the algorithm was based on prior work or work of other teams, and a 1000 character abstract of their method. Additionally to the written submission, teams needed to give the challenge organizers access to their algorithm for review and further validation. In addition to the forum post, the organizers individually reached out to the top 30 teams of the competition’s leaderboard and invited them to sign up.
After the deadline, five members of the organizer team (W.B., G.L., H.P., K.K., P.R.) individually reviewed all submissions and scored them on a five-point scale (1: strong reject, to 5: strong accept). The score was based on the overall method, originality, quality of the submission, and their algorithm’s performance on the internal validation set. After scoring, all teams were discussed within the organizer team and a final ranking was established. Of all submissions, 15 teams (competition ranking in parentheses) were invited to join the PANDA consortium: PND (1), Save The Prostate (2), NS Pathology (4), Kiminya (5), BarelyBears (6), ctrasd123 (7), ChienYiChi (8), vanda (10), iafoss (11), Manuel Campos (12), Dmitry A. Grechka (18), KovaLOVE v2 (19), Aksell (20), rähmä.ai (27) and UCLA Computational Diagnostics Lab (28). Additionally, of these 15, eight teams were invited to present their method at the PANDA MICCAI workshop (October 8th, 2020, MICCAI 2020 virtual conference). All selected teams were included in the blinded validation on the external validation sets.
Summary of participating teams’ methods
All teams that were selected as part of the PANDA consortium were asked to report a summary of their method, including their training approach, dataset operations, and model architecture. All algorithms selected for the independent validation made use of deep learning-based techniques.
Many existing methods911 employ so-called patch-based training, where a biopsy is first analyzed at high magnification region by region, and the predictions for these regions are combined to determine the slide-level label. In contrast, during the competition, end-to-end training emerged as the dominant strategy for automated Gleason grading. This means that the entire WSI is treated as one data sample associated with a single target label. Due to the slides’ dimensions, a full WSI does not fit a typical GPU’s memory, and alternative methods were used to circumvent this. A popular technique was proposed by the competition participant iafoss, and adopted and modified by several participants, including the winner of the competition (PND): In brief, this approach consisted in selecting a subset of patches from a WSI based on simple filtering criteria, and processing these patches in a convolutional neural network (CNN) such that the feature representations of the patches are concatenated before they are being fed to the CNN’s classification layers. The usage of additional models to select the most informative tiles, typically operating on a low resolution version of the WSI, was also proposed (Aksell, ChienYiChi, Save The Prostate, UCLA Computational Diagnostics Lab). Other training approaches included for example using CNNs as patch-wise feature extractors, followed by a recurrent neural network for aggregating the patch-level feature representation to a WSI-level output (Dmitry A. Grechka).
Besides the use of end-to-end training, a second common denominator among leading competition participants was the extensive use of data cleaning. The development set contained substantial levels of label noise. For the cases of Radboud University Medical Center, the labels were generated semi-automatically. For the cases from Karolinska Institute, the reference standard was based on the assessment of a single pathologist, and the semi-automatically generated pixel-level labels indicated malignant regions only in an approximate manner. Several teams used (semi-)automatic techniques to remove slides with artifacts, low-quality slides, and images where teams expected errors in the reference standard. For example, BarelyBears used Online Uncertainty Sample Mining and excluded 10% of training patches associated with the highest average loss values during training. PND and Dmitry A. Grechka identified samples with potentially erroneous labels after completing model training, based on the predicted ISUP grade group differing from the target label by more than a specified amount. Training was then repeated after exclusion of such samples. In the approaches of iafoss and Save The Prostate, the training labels were adjusted iteratively instead of excluding samples.
Interestingly, while some teams experimented with multi-resolution approaches and used low resolution images for selecting regions of interest, virtually all of the proposed solutions used the intermediate resolution level of the input WSI for producing the final ISUP grade group predictions. This corresponds to approximately 2 µm pixel spacing (and a typical magnification of 5X), which can be considered a relatively coarse resolution.
Finally, to improve performance and increase the algorithms’ generalization ability, all of the 15 teams utilized ensembles of multiple models. Ensemble strategies differed from team to team, ranging from models trained using different hyperparameters, different patch selection strategies or different loss functions to a set of different neural network architectures combined into an ensemble.
Supplementary figures
Supplementary tables
| EU Development set (Radboud) | EU Development set (Karolinska) | EU Tuning Set (Radboud) | EU Tuning Set (Karolinska) | |
|---|---|---|---|---|
| Source | Radboud University Medical Center, Netherlands | Karolinska Institutet, Sweden | Radboud University Medical Center, Netherlands | Karolinska Institutet, Sweden |
| Scanning equipments | 3DHistech Pannoramic Flash II 250 (3DHistech, Hungary) | Aperio AT2 (Leica, Germany) & Hamamatsu C9600-12 (Hamamatsu, Japan) | 3DHistech Pannoramic Flash II 250 (3DHistech, Hungary) | Aperio AT2 (Leica, Germany) & Hamamatsu C9600-12 (Hamamatsu, Japan) |
| Pixel spacing of original scanned slides | 0.24 µm | 0.50 µm and 0.45 µm | 0.24 µm | 0.50 µm and 0.45 µm |
| Pixel spacing of downsampled slides, available to the algorithms | 0.48 µm | 0.50 µm and 0.45 µm | 0.48 µm | 0.50 µm and 0.45 µm |
| EU Internal Validation Set (Radboud) | EU Internal Validation Set (Karolinska) | US External Validation set | EU External Validation set | |
|---|---|---|---|---|
| Source | Radboud University Medical Center, Netherlands | Karolinska Institutet, Sweden | Medical Laboratories, CA/UT, USA; Tertiary Teaching Hospital, CA, USA | Karolinska University Hospital, Sweden |
| Scanning equipments | 3DHistech Pannoramic Flash II 250 (3DHistech, Hungary) | Aperio AT2 (Leica, Germany) & Hamamatsu C9600-12 (Hamamatsu, Japan) | Aperio AT2 (Leica, Germany) | Hamamatsu C13220-01 (Hamamatsu, Japan) |
| Pixel spacing of original scanned slides | 0.24 µm | 0.50 µm and 0.45 µm | 0.25 µm | 0.46 µm |
| Pixel spacing of downsampled slides, available to the algorithms | 0.48 µm | 0.50 µm and 0.45 µm | 0.50 µm | 0.46 µm |
| Dataset / Metric | Internal validation set | US external validation set | EU external validation set | International pathologists comparison | US pathologists comparison |
|---|---|---|---|---|---|
| Quadratically weighted kappa (95% CI) | 0.940 (0.928-0.952) | 0.892 (0.874-0.909) | 0.899 (0.869-0.924) | 0.887 (0.820-0.934) | 0.870 (0.826-0.904) |
| Sensitivity (95% CI) | 99.7% (99.0-100.0) | 99.2% (98.3-99.8) | 98.2% (96.3-99.6) | 100.0% (100.0-100.0) | 99.0% (97.4-100.0) |
| Specificity (95% CI) | 96.4% (93.8-98.7) | 81.9% (77.1-86.6) | 89.8% (83.8-95.1) | 100.0% (100.0-100.0) | 82.5% (69.7-93.5) |
References
- Epstein JI. An Update of the Gleason Grading System. Journal of Urology. 2010;183(2):433–440. doi:10.1016/j.juro.2009.10.046
- Mohler JL, Antonarakis ES, Armstrong AJ, D’Amico AV, Davis BJ, Dorff T, et al. Prostate Cancer, Version 2.2019, NCCN Clinical Practice Guidelines in Oncology. Journal of the National Comprehensive Cancer Network J Natl Compr Canc Netw. 2019;17(5):479–505. https://jnccn.org/view/journals/jnccn/17/5/article-p479.xml
- Van Leenders GJ, Van Der Kwast TH, Grignon DJ, Evans AJ, Kristiansen G, Kweldam CF, et al. The 2019 International Society of Urological Pathology (ISUP) consensus conference on grading of prostatic carcinoma. The American journal of surgical pathology. 2020;44(8):e87.
- Epstein JI, Egevad L, Amin MB, Delahunt B, Srigley JR, Humphrey PA. The 2014 International Society of Urological Pathology (ISUP) Consensus Conference on Gleason Grading of Prostatic Carcinoma. The American Journal of Surgical Pathology. 2016;40(2):1. doi:10.1097/pas.0000000000000530
- Allsbrook WC, Mangold KA, Johnson MH, Lane RB, Lane CG, Amin MB, et al. Interobserver reproducibility of Gleason grading of prostatic carcinoma: Urologic pathologists. Human Pathology. 2001;32(1):74–80. doi:10.1053/hupa.2001.21134
- Melia J, Moseley R, Ball R, Griffiths D, Grigor K, Harnden P, et al. A UK-based investigation of inter-and intra-observer reproducibility of Gleason grading of prostatic biopsies. Histopathology. 2006;48(6):644–654.
- Ozkan TA, Eruyar AT, Cebeci OO, Memik O, Ozcan L, Kuskonmaz I. Interobserver variability in Gleason histological grading of prostate cancer. Scandinavian Journal of Urology. 2016;50(6):420–424. doi:10.1080/21681805.2016.1206619
- Egevad L, Ahmad AS, Algaba F, Berney DM, Boccon-Gibod L, Compérat E, et al. Standardization of Gleason grading among 337 European pathologists. Histopathology. 2013;62(2):247–256. doi:10.1111/his.12008
- Nagpal K, Foote D, Tan F, Liu Y, Chen PHC, Steiner DF, et al. Development and validation of a deep learning algorithm for Gleason grading of prostate cancer from biopsy specimens. JAMA oncology. 2020;6(9):1372–1380.
- Bulten W, Pinckaers H, van Boven H, Vink R, de Bel T, van Ginneken B, et al. Automated deep-learning system for Gleason grading of prostate cancer using biopsies: a diagnostic study. The Lancet Oncology. 2020;21(2):233–241. doi:10.1016/S1470-2045(19)30739-9
- Ström P, Kartasalo K, Olsson H, Solorzano L, Delahunt B, Berney DM, et al. Artificial intelligence for diagnosis and grading of prostate cancer in biopsies: a population-based, diagnostic study. The Lancet Oncology. 2020;21(2):222–232.
- Steiner DF, Nagpal K, Sayres R, Foote DJ, Wedin BD, Pearce A, et al. Evaluation of the Use of Combined Artificial Intelligence and Pathologist Assessment to Review and Grade Prostate Biopsies. JAMA Network Open. 2020;3(11):e2023267–e2023267. doi:10.1001/jamanetworkopen.2020.23267
- Bulten W, Balkenhol M, Belinga JJA, Brilhante A, Çakir A, Egevad L, et al. Artificial Intelligence Assistance Significantly Improves Gleason Grading of Prostate Biopsies by Pathologists. Modern Pathology. 2021;34:660–671. doi:10.1038/s41379-020-0640-y
- Challen R, Denny J, Pitt M, Gompels L, Edwards T, Tsaneva-Atanasova K. Artificial intelligence, bias and clinical safety. BMJ Quality & Safety. 2019;28(3):231–237.
- Nagendran M, Chen Y, Lovejoy CA, Gordon AC, Komorowski M, Harvey H, et al. Artificial intelligence versus clinicians: systematic review of design, reporting standards, and claims of deep learning studies. BMJ. 2020;368. doi:10.1136/bmj.m689
- AI diagnostics need attention. Nature. 2018;555(7696):285–285. doi:10.1038/d41586-018-03067-x
- Yasaka K, Abe O. Deep learning and artificial intelligence in radiology: Current applications and future directions. PLoS medicine. 2018;15(11):e1002707.
- Ehteshami Bejnordi B, Veta M, van Diest PJ, van Ginneken B, Karssemeijer N, Litjens G, et al. Diagnostic Assessment of Deep Learning Algorithms for Detection of Lymph Node Metastases in Women With Breast Cancer. Journal of the American Medical Association. 2017;318(22):2199–2210. doi:10.1001/jama.2017.14585
- Maier-Hein L, Eisenmann M, Reinke A, Onogur S, Stankovic M, Scholz P, et al. Why rankings of biomedical image analysis competitions should be interpreted with care. Nature communications. 2018;9(1):1–13.
- Bulten W, Litjens G, Pinckaers H, Ström P, Eklund M, Kartasalo K, et al. The PANDA challenge: Prostate cANcer graDe Assessment using the Gleason grading system. Zenodo. 2020. doi:10.5281/zenodo.3715938
- LeCun Y, Bengio Y, Hinton G. Deep learning. Nature. 2015;521(7553):436–444.
- Litjens G, Kooi T, Ehteshami Bejnordi B, Setio AAA, Ciompi F, Ghafoorian M, et al. A Survey on Deep Learning in Medical Image Analysis. Medical image analysis. 2017;42:60–88. doi:10.1016/j.media.2017.07.005
- van der Laak J, Ciompi F, Litjens G. No pixel-level annotations needed. Nature biomedical engineering. 2019;3(11):855–856.
- Hartman DJ, Van Der Laak JA, Gurcan MN, Pantanowitz L. Value of public challenges for the development of pathology deep learning algorithms. Journal of pathology informatics. 2020;11.
- Kelly CJ, Karthikesalingam A, Suleyman M, Corrado G, King D. Key challenges for delivering clinical impact with artificial intelligence. BMC medicine. 2019;17(1):1–9.
- Rajkomar A, Hardt M, Howell MD, Corrado G, Chin MH. Ensuring fairness in machine learning to advance health equity. Annals of internal medicine. 2018;169(12):866–872.
- Prostate cANcer graDe Assessment (PANDA) Challenge. Accessed March 18, 2021. https://panda.grand-challenge.org
- Merkel D. Docker: lightweight linux containers for consistent development and deployment. Linux journal. 2014;2014(239):2.
- Kurtzer GM, Sochat V, Bauer MW. Singularity: Scientific containers for mobility of compute. PloS one. 2017;12(5):e0177459.
- Grönberg H, Adolfsson J, Aly M, Nordström T, Wiklund P, Brandberg Y, et al. Prostate cancer screening in men aged 50–69 years (STHLM3): a prospective population-based diagnostic study. The Lancet Oncology. 2015;16(16):1667–1676. doi:10.1016/S1470-2045(15)00361-7
- Ström P, Nordström T, Aly M, Egevad L, Grönberg H, Eklund M. The Stockholm-3 model for prostate cancer detection: algorithm update, biomarker contribution, and reflex test potential. European urology. 2018;74(2):204–210.
- Marée R, Rollus L, Stévens B, Hoyoux R, Louppe G, Vandaele R, et al. Collaborative analysis of multi-gigapixel imaging data using Cytomine. Bioinformatics. 2016;32(9):1395–1401.
- Gordetsky J, Epstein J. Grading of prostatic adenocarcinoma: current state and prognostic implications. Diagnostic pathology. 2016;11(1):1–8.
Feedback? Questions?
Do you have a question or comment about this post? Feel free to reach out to me via the contact page.